


1. Introduction
Lung cancer is one of the most invasive and lethal cancer types for both females and males [1,2]. More than 80% of lung cancers are non-small-cell lung cancers (NSCLC) [3], while the rest comprises small-cell lung cancer (SCLC) [4]. There are three subtypes of NSCLC [5], i.e., lung squamous-cell carcinoma (LUSC) [6], lung adenocarcinoma (LUAD) [7], and large-cell lung cancer [8]. Complicated molecular mechanisms are involved in the occurrence and progression of different lung cancer subtypes, and various diagnosis and treatment technologies have been developed based on these molecular mechanisms [9].
Biomedical imaging technologies undergo rapid developments to serve as a non-invasive diagnosis tool for malignant lesions like lung cancer. Mammography is a popular technology for detecting pulmonary nodules in lung cancer [10] and nodular breast lesions in breast cancer [11], but its usage in diagnosing lung cancer is limited [12]. Magnetic resonance imaging (MRI) uses a power magnetic field to create a 3D picture inside the body without radiations like X-rays, and it is very sensitive to the detection of internal inflammation lesions [13]. Low-dose computed tomography (LDCT) has been widely used in the diagnosis of lung cancer, especially in screening small peripheral pulmonary nodules and early-stage adenocarcinoma [14]. Positron emission tomography (PET) scans can reveal the metabolic status inside the body and are usually integrated with the computed tomography (CT) technology to create 3D PET/CT images of internal lesions [15].
A transcriptome is a set of the expression levels of the transcribable regions in the genome using microarray or sequencing technologies [16], and it is one of the most popular OMIC data types with abundant publicly available datasets [17]. The transcriptome has been extensively used in the biological investigation of lung cancers [2]. Transcription factors (TFs) bind to sequence-specific genomic regions and regulate the expression levels of various transcripts [18]. A precise investigation of how the TFs are involved in the onset and development of lung cancers facilitates the detection of candidate therapeutic targets and improves the prognosis of lung cancers. The transcription factor STAT3 (signal transducer and activator transcription 3) is kept constitutively expressed and could be related to the tumorigenesis of lung cancer [19]. Another transcription factor, Pokemon (a central regulator of an important tumor suppressor gene, ARF), is expressed in non-small-cell lung cancers (NSCLC) by acting on the upstream regions of multiple proto-oncogenes and tumor suppressor genes [20]. The expression level of the well-known prognostic biomarker PD-L1 shows a strong correlation with the survival of multifocal lung cancer patients [21].
Our hypothesis is that previous studies have ignored many undifferentially expressed genes, whose transcription regulation may be quantitatively altered in a phenotype. We use the recently developed algorithm mqTrans [22,23] to quantitatively measure the transcription regulation machinery in healthy samples. Then, we screen three lung cancer datasets for undifferentially expressed genes whose quantitative transcription regulation is significantly altered in lung cancer samples compared to those in the healthy controls. The inter-feature correlations of these genes show significant associations with lung cancer, but these genes do not show differential expression themselves in one or more datasets. We call these genes the dark biomarkers of lung cancers, because their mqTrans values are substantially changed between the lung cancer samples and the controls, although their original expression levels remain undifferentially expressed.
2. Materials and Methods
2.1. Summary of the Datasets
We collected three datasets—GSE33356/GSE18842/GSE30219—from the Gene Expression Omnibus (GEO) database [24] for screening and independently validating undifferentially expressed genes with altered transcription regulation in lung cancer. All the three datasets were transcriptomes profiled on the platform GPL570 [25]. There were 54,675 transcriptomic features per sample, and they were annotated as the mRNA gene features or transcription factor (TF) features based on the annotations of gene symbols in the platform annotation release 36 of the Human Genome U133 Plus 2.0 Array and the database Human TFDB [26]. Dataset GSE33356 consisted of 60 lung cancer samples and 60 healthy controls. There were 46 lung cancer and 45 control samples in dataset GSE18842. The third dataset, GSE30219, had 293 lung cancer samples and 14 controls. The datasets were retrieved from the GEO database after a standard preprocessing step [24].
We used 70% of the healthy control samples of dataset GSE33356 to train the mqTrans model and evaluated the mqTrans features on 100% of the lung cancer samples and the remaining 30% of the controls in the same dataset. The results were further screened with two independent datasets, GSE18842 and GSE30219. The detailed description of the experimental procedure is discussed in the following sections.
2.2. Expression Prediction Using Upstream TFs
Gene expression is strictly controlled by the transcription regulation machinery, and this study assumes that a gene’s expression level may be formulated as a regression model of the TFs’ expression levels.
Such a regression model is defined as a linear regression function [27] between the expression levels of one mRNA gene and multiple TFs, i.e., LinearR(mRNA) = W0 + W1 × TF1 + … + Wn × TFn, where Wi is the weight of TFi, and W0 is a constant. The algorithm is implemented using the LinearRegression function of the package sklearn.linear_model [28] in the Python programming language version 3.8.
The Pearson correlation coefficient (PCC) is used to ensure the quality of regression models. Let the predicted and real expression levels of a gene F be mRNA’(F) and mRNA(F). The gene is kept for further screening only if PCC(mRNA’(F), mRNA(F)) > 0.5. Another metric, the root mean square error (RMSE), has been also popularly used to measure the average difference between a model’s predicted and actual values. This study follows [29,30] in using the PCC to measure the correlation between the predicted values and the original expression levels of an mRNA gene.
2.3. Calculation of the mqTrans Features
This study hypothesized that the transcription regulation of some genes was quantitatively maintained among healthy control samples and that the altered transcription regulation of a gene could be quantitatively measured from the difference of this gene’s real expression level to the predicted level using a regression model trained on the healthy controls. Therefore, the difference between the predicted and real expression levels of a gene F is defined as the engineered mqTrans feature, as follows: mqTrans(F) = |mRNA’(F) − mRNA(F)|. The mqTrans model was trained using the healthy control samples, and the predicted expression level of a screened gene F was ensured to be highly correlated with the real level using a PCC(mRNA’(F), mRNA(F)) > 0.5. So, a gene F’s mqTrans feature, mqTrans(F), tends to be close to zero if this gene’s transcription regulation in the current query sample is quantitatively maintained in the same pattern as the training healthy samples [23].
This study engineered the mqTrans features of the testing samples for all the original features using the trained regression mqTrans models and the high correlations between the predicted and real expression levels in the training samples.
The differential expression was evaluated between the lung cancer (positive) and healthy control (negative) samples using the p-value of a t-test [31]. The statistical t-test was implemented using the function ttest_ind_from_stats of the package scipy.stats in the Python programming language version 3.8. A feature was supposed to be significantly associated with lung cancer if its t-test p-value < 0.05. The lung cancer and control samples were evaluated in both the original and mqTrans feature spaces.
2.4. Experimental Design
This study plans to screen for the transcriptomic features that are not differentially expressed in lung cancer samples but whose transcription regulation is significantly altered in lung cancer, as illustrated in Figure 1. We firstly train mqTrans models using 70% of the healthy controls in dataset GSE33356 and ensure the regression qualities with a requirement of PCC(mRNA’(F), mRNA(F)) > 0.5, where mRNA’(F) and mRNA(F) are the predicted and real expression levels of a gene F. Then, we calculate the mqTrans features for those transcriptomic features with the above-trained mqTrans models.
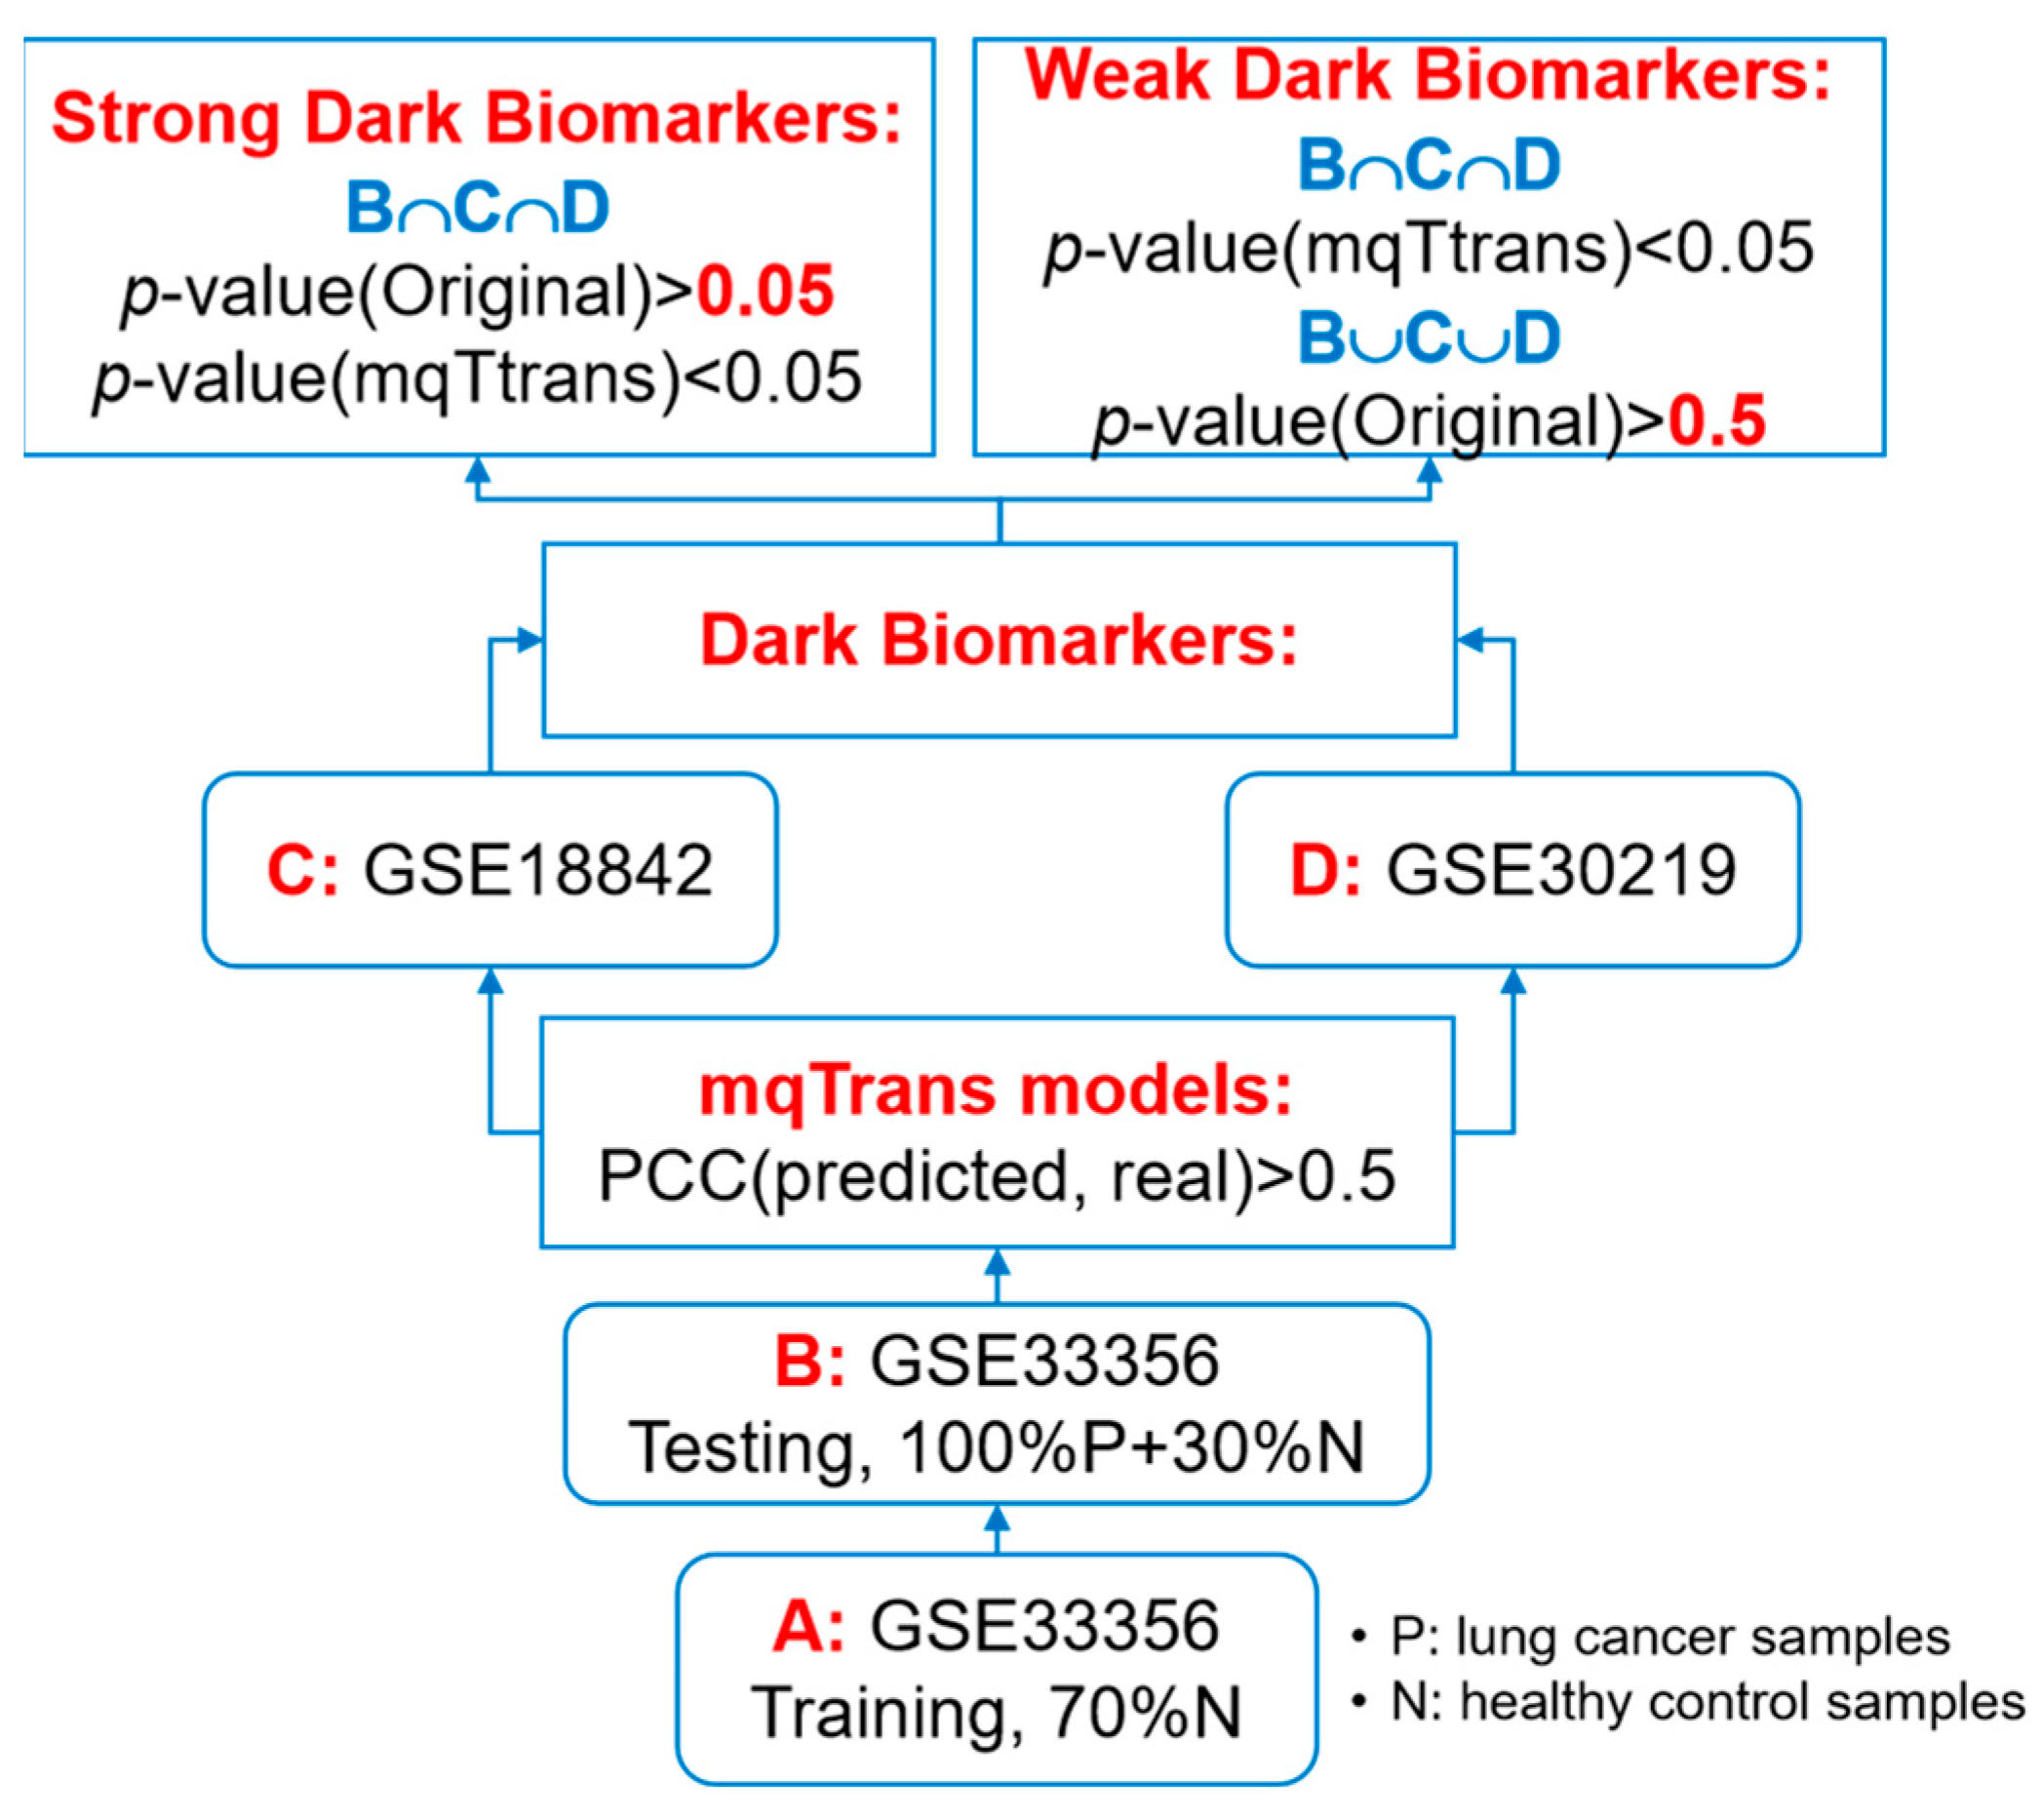
Figure 1. Flowchart of the experimental design of this study.
We screen two groups of dark biomarkers, as shown in Figure 1. We define a transcriptomic feature as a dark biomarker between the disease group and the control group if its original values are not differentially expressed (p-value(Original) > 0.05) and its mqTrans values are differentially expressed (p-value(mqTrans) < 0.05). A strong dark biomarker meets the dark biomarker requirement in all the investigated datasets, while a weak dark biomarker only meets the requirement in one dataset and has a p-value(Original) > 0.5 in the same dataset.
3. Results and Discussion
3.1. Data Preprocessing
This study screened the dark biomarkers of lung cancer samples in three independent datasets (GSE33356, GSE18842, and GSE30219). The transcriptomic features without annotations in the “Gene Symbol” of the platform data of GPL570 were excluded. Among the remaining 45,782 features, 3501 features were annotated as the transcription factor (TF) features based on the information from the database Human TFDB [26]. The transcriptomic data were normalized to [0, 1] [32].
The above section, “Summary of the Datasets”, showed that dataset GSE33356 has the largest number of healthy control samples. So, 70% of the healthy controls in this dataset were randomly retrieved to train unsupervised mqTrans models. The remaining samples of dataset GSE33356 were used as the testing dataset. The other two datasets, GSE18842 and GSE30219, were used to independently test the detected biomarkers.
3.2. The Quantitative Transcription Regulatory Models
Many OMIC data sources can be integrated to computationally calculate a gene’s expression [33]. Sequence features have been previously explored for their correlations with the gene expression levels in Caenorhabditis elegans via a Bayesian probabilistic framework [34]. TF-binding statuses with the ChIP-seq and chromatin data have been integrated in a regression model to predict gene expression [35]. Deep learning algorithms, like convolutional neural network (CNN), have been used to consolidate the cis signals in promoters and distal regulatory regions for the prediction of cell-type-specific gene expression [36]. But, the transcriptome is one of the OMIC types with the most abundant public datasets and open-source analysis tools [22,23,37].
We screened for mqTrans regression models trained in a dataset A with PCC > 0.5 between the predicted and real expression levels in a dataset B, as shown in Figure 2. A threshold PCC > 0.5 has been previously used to determine the co-expression patterns of two biological molecules [38]. There were 5820 mqTrans regression models achieving a PCC > 0.5 in dataset B. A total of 2396 and 1146 of these models kept achieving a PCC > 0.5 in the two datasets C and D, respectively. There were 116 mqTrans models achieving a PCC > 0.9 on the validating samples of the same dataset, GSE33356. Even on the two independent testing datasets C (GSE18842) and D (GSE30219), 49 and 24 mqTrans regression models achieved a PCC > 0.9 between the predicted and real expression levels.
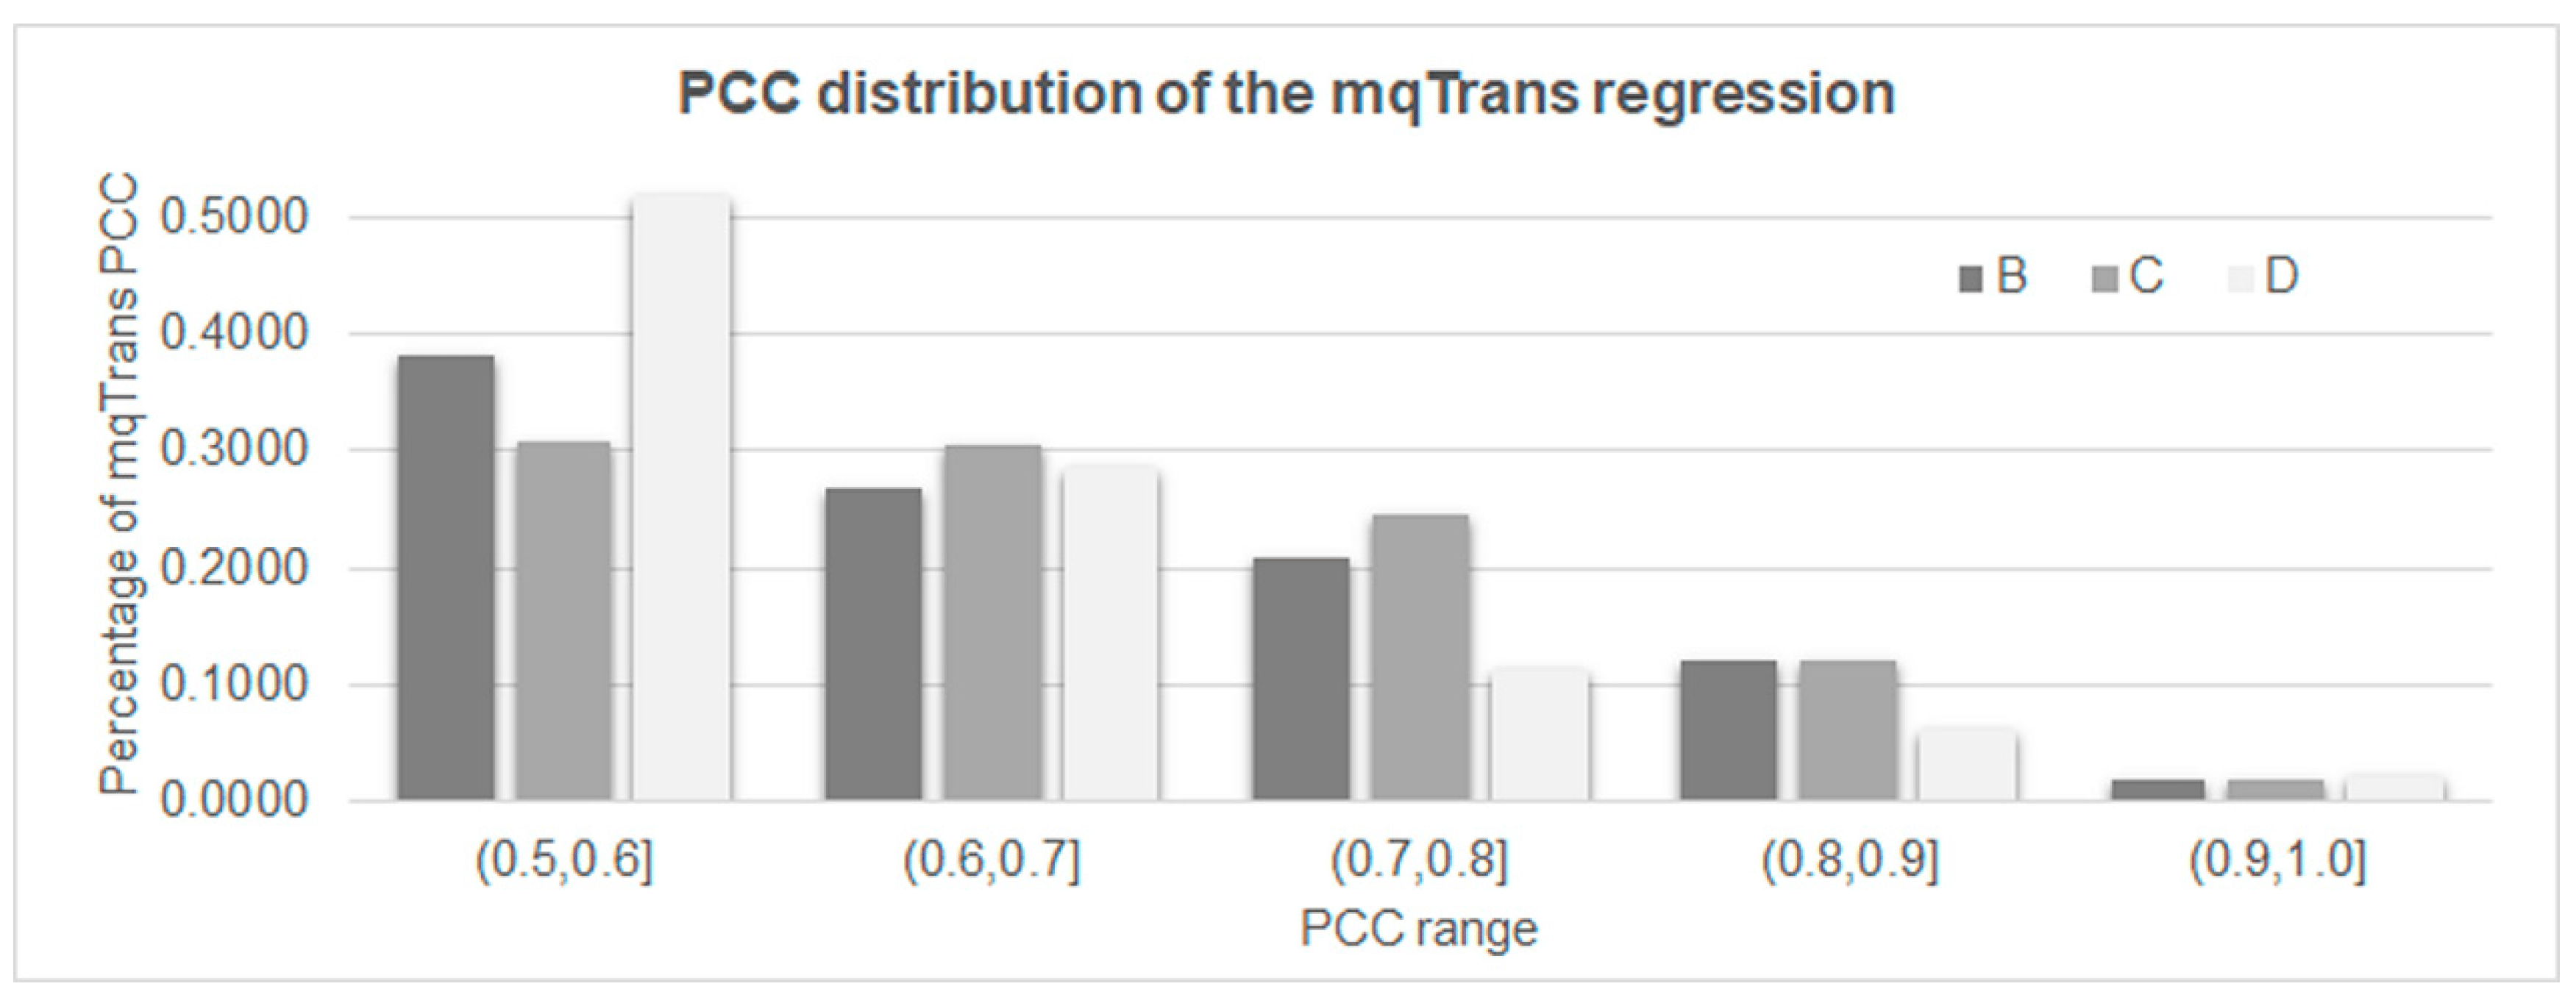
Figure 2. The distribution of the PCC values of the transcriptomic features with a PCC > 0.5 in all four datasets. Dataset A consists of the 70% randomly chosen healthy control samples from dataset GSE33356 for training the mqTrans models, and the remaining samples of dataset GSE33356 constitutes dataset B. Datasets C and D represent datasets GSE18842 and GSE30219.
3.3. Differential Transcription Regulation Analysis
The engineered mqTrans features were screened for their differential representations between the two groups of lung cancer and healthy control samples. The mqTrans feature of the original transcriptomic feature F in a query sample S was defined as mqTrans(F) = |mRNA’(F) − mRNA(F)|, where the transcriptomic value of F was mRNA(F), and its predicted expression was mRNA’(F). The expression prediction model was trained using the healthy controls. So, the engineered mqTrans(F) quantitatively measured the change of the F’s transcription regulation in the query sample S compared with the training group of the healthy control samples.
A differential transcription regulation (DeTouR) analysis was conducted to calculate the differential representations of the mqTrans features between the two groups of lung cancer and healthy control samples using the above formulations. The mqTrans regression models were trained using randomly extracted healthy controls, and the differential analysis used 0.05 as the significance threshold of the t-test p-values.
There were 1880, 1278, and 381 features with a significantly altered transcription regulation in the three datasets B/C/D, as shown in Figure 3. We called them the DeTouR features. There were about 1/3 of mqTrans features whose transcription regulation was significantly altered in the two datasets B (32.30%) and D (33.25%), respectively. More than half (53.34%) of the mqTrans features in dataset C were differentially transcriptionally regulated. There were even 80, 452, and 79 mqTrans features with DeTouR p-values < 0.05 in the three datasets B/C/D, respectively.
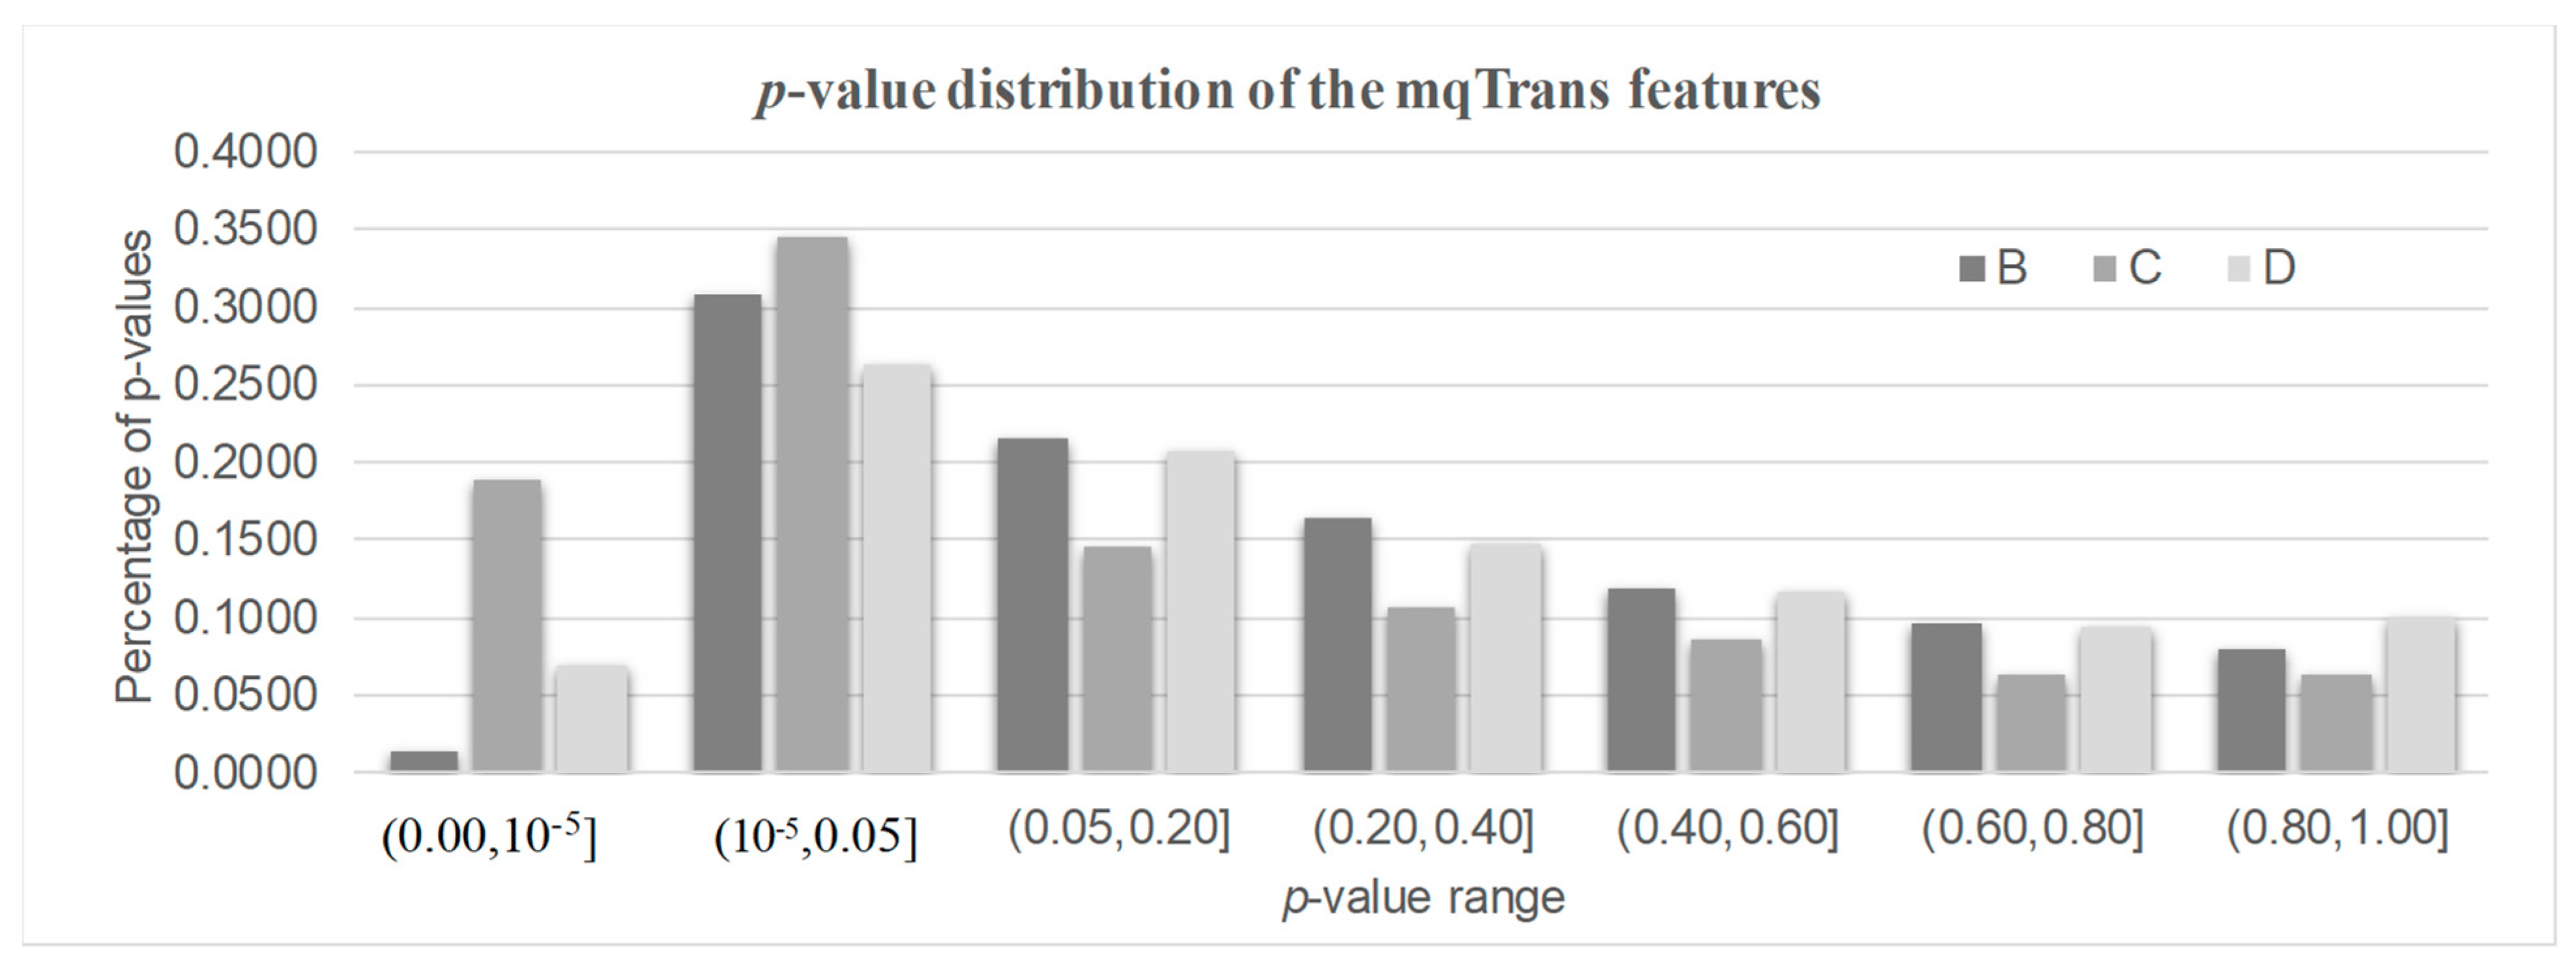
Figure 3. The distribution of the p-values of the mqTrans features in all three testing datasets. The 30% healthy controls and 100% lung cancer samples of dataset GSE33356 constitute dataset B. Datasets C and D represent datasets GSE18842 and GSE30219.
3.4. DeTouR Features Ignored by a Conventional Differential Analysis
We further screened the DeTouR features that would have been ignored in a conventional differential analysis. Most of the existing biomarker detection studies evaluate the differential significance of a given feature between two groups of samples using a statistical test like the t-test [39]. Many features with a statistical significance of p-values > 0.05 would be ignored, with the assumption that these features are not associated with the investigated phenotypes.
We focused on those DeTouR features whose original expression was not differentially expressed in the respective datasets, as shown in and in . The PCC values in show that the expression levels of these DeTouR features were confidently predicted. Two DeTouR features, 208296_x_at and 229625_at, were detected to be differentially represented in the mqTrans level but not in the original expression level in all three datasets B, C, and D. The mqTrans features of these two features were differentially expressed in the lung cancer samples (p-values < 0.05), while their original expression levels were not (p-values > 0.05) in all three datasets B, C, and D. The original expression levels of 229625_at were almost identical between the two groups of lung cancer and healthy control samples in the two datasets GSE33356 (p-value = 7.42 × 10⁻¹) and GSE30219 (p-value = 6.40 × 10⁻¹). These two features were regarded as strong dark biomarkers from the mqTrans view of all three datasets B, C, and D, although they would have been ignored by a conventional differential expression analysis using any of these three datasets. If we had used a conventional t-test to rank these features, both of these two strong dark biomarkers would have ranked lower than 5000 in all three datasets, dbB/dbC/dbD . Most studies would not investigate such lowly ranked features.
We observed that some DeTouR features had very large p-values at their original expression levels. So, we included 11 additional DeTouR features as the weak dark biomarkers if their original expression levels had p-values > 0.5 in at least one dataset. For example, the original expressions of DeTouR feature 225107_at showed almost identical distributions between the lung cancer and healthy control samples, with a p-value = 9.54 × 10⁻¹ in dataset B. Another DeTouR feature, 203954_x_at, showed highly similar distributions between the lung cancer and healthy control samples in the original expression levels in the two datasets C (p-value = 6.33 × 10⁻¹) and D (p-value = 2.84 × 10⁻¹). These 11 additional features could have been ignored in a conventional differential analysis, at least in some datasets, and were regarded as the weak dark biomarkers.
We performed a functional enrichment analysis and a protein–protein interaction network assessment for the 13 dark biomarker genes associated with lung cancer. For the functional enrichment analysis, we used the KEGG rest API (https://www.kegg.jp/kegg/rest/keggapi.html, accessed on 1 November 2023) to obtain the latest gene annotations of the KEGG pathway as the background, mapped the dark biomarker genes to the background set, and performed an enrichment analysis using the R software package clusterProfiler (version 3.14.3) [40] to obtain the gene set enrichment results. The minimum gene set size was set to five, and the maximum gene set size was set to five thousand, with a p value < 0.05. Protein–protein interaction (PPI) analyses were conducted utilizing the online STRING database [41], which provides functional protein association networks (https://cn.string-db.org/, accessed on 1 November 2023). Additionally, the protein interaction mapping was performed using the Cytoscape local client (Cytoscape_v3.6.1). The results in Figure 4 show that there were ultimately seven dark biomarkers identified to interact with genes within the TNF signaling pathway, which is actively involved in the development and metastasis of lung cancer [42,43,44].
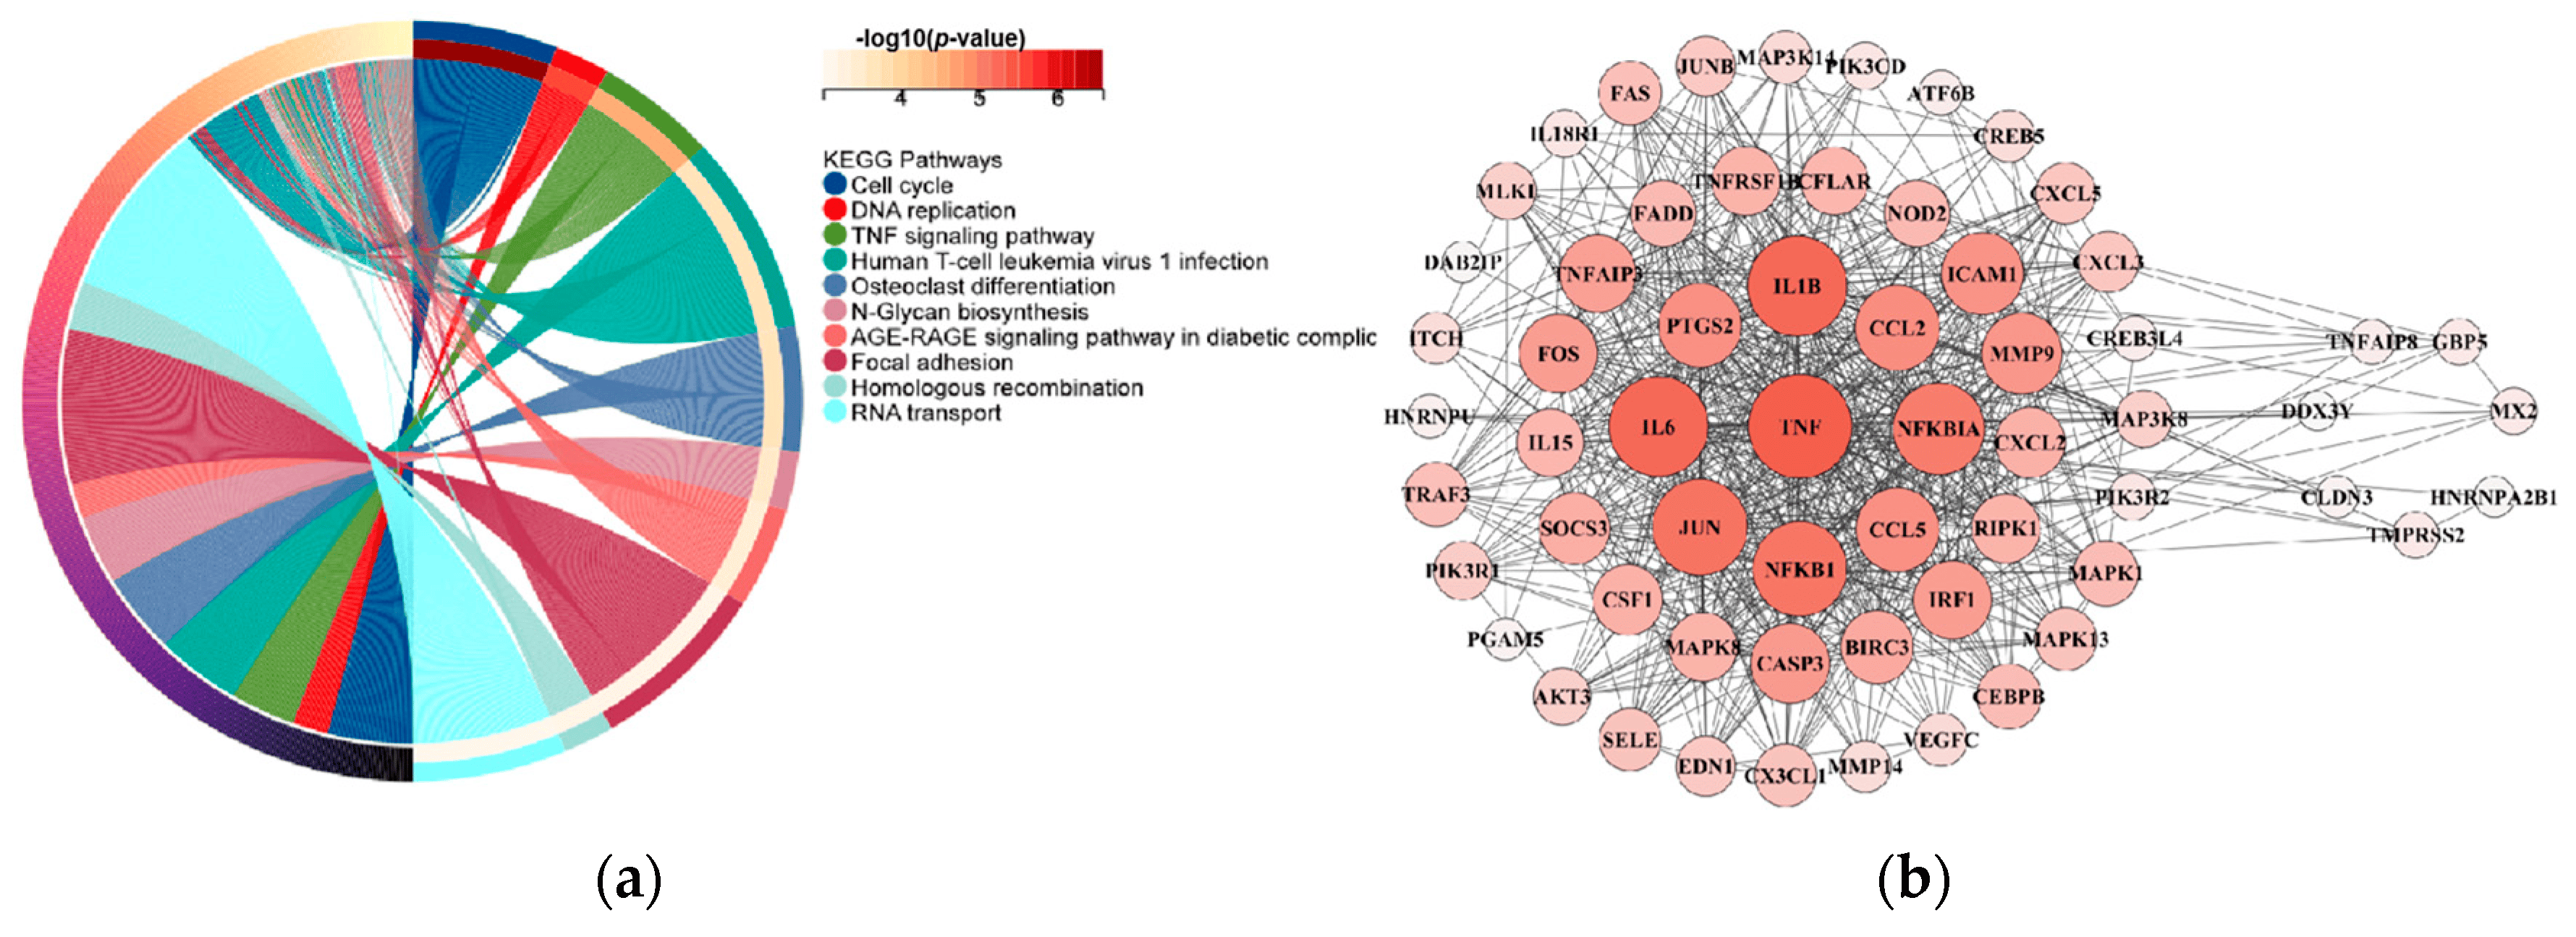
Figure 4. Lung cancer differentially expressed gene enrichment analysis and PPI network analysis of 13 dark biomarker genes. (a) The left side of the figure displays the top ten pathways from the KEGG enrichment analysis results. Specifically, we selected 54 genes in the TNF signaling pathway. (b) On the right side, the protein–protein interaction (PPI) analyses yield results indicating that seven dark biomarkers have node interactions with lung cancer significant difference genes.
3.5. Differential Patterns in the Two Levels
The original expression levels of all 13 dark biomarkers showed limited differences between the lung cancer and healthy control samples, as shown in Figure 5A. If we took the ratio of the average values between the lung cancer and healthy control samples (P/N ratio) to measure the difference of a feature between these two sample groups, the original expression levels of these 13 features would have P/N ratios between [0.9752, 1.1824], [0.6864, 1.1033], and [0.6626, 1.0762] in the three datasets B, C, and D, respectively. These 13 features showed much larger changes in the engineered mqTrans levels than those in the original expression levels, illustrated via the distributions of the t-test p-values . The minimum and maximum P/N ratios of these mqTrans features reached 1.6559 and 3.3574 in dataset B. Similar increased changes were observed in the other two datasets. We used the online tool shinyCircos to visualize the distribution of the thirteen dark biomarkers [45], and we observed that these dark biomarkers were distributed across six chromosomes (Figure 6). There were four dark biomarkers in each of the two chromosomes 1 and 7. The two strong dark biomarkers, GBP5 and TNFAIP8, were in chromosomes 1 and 5.
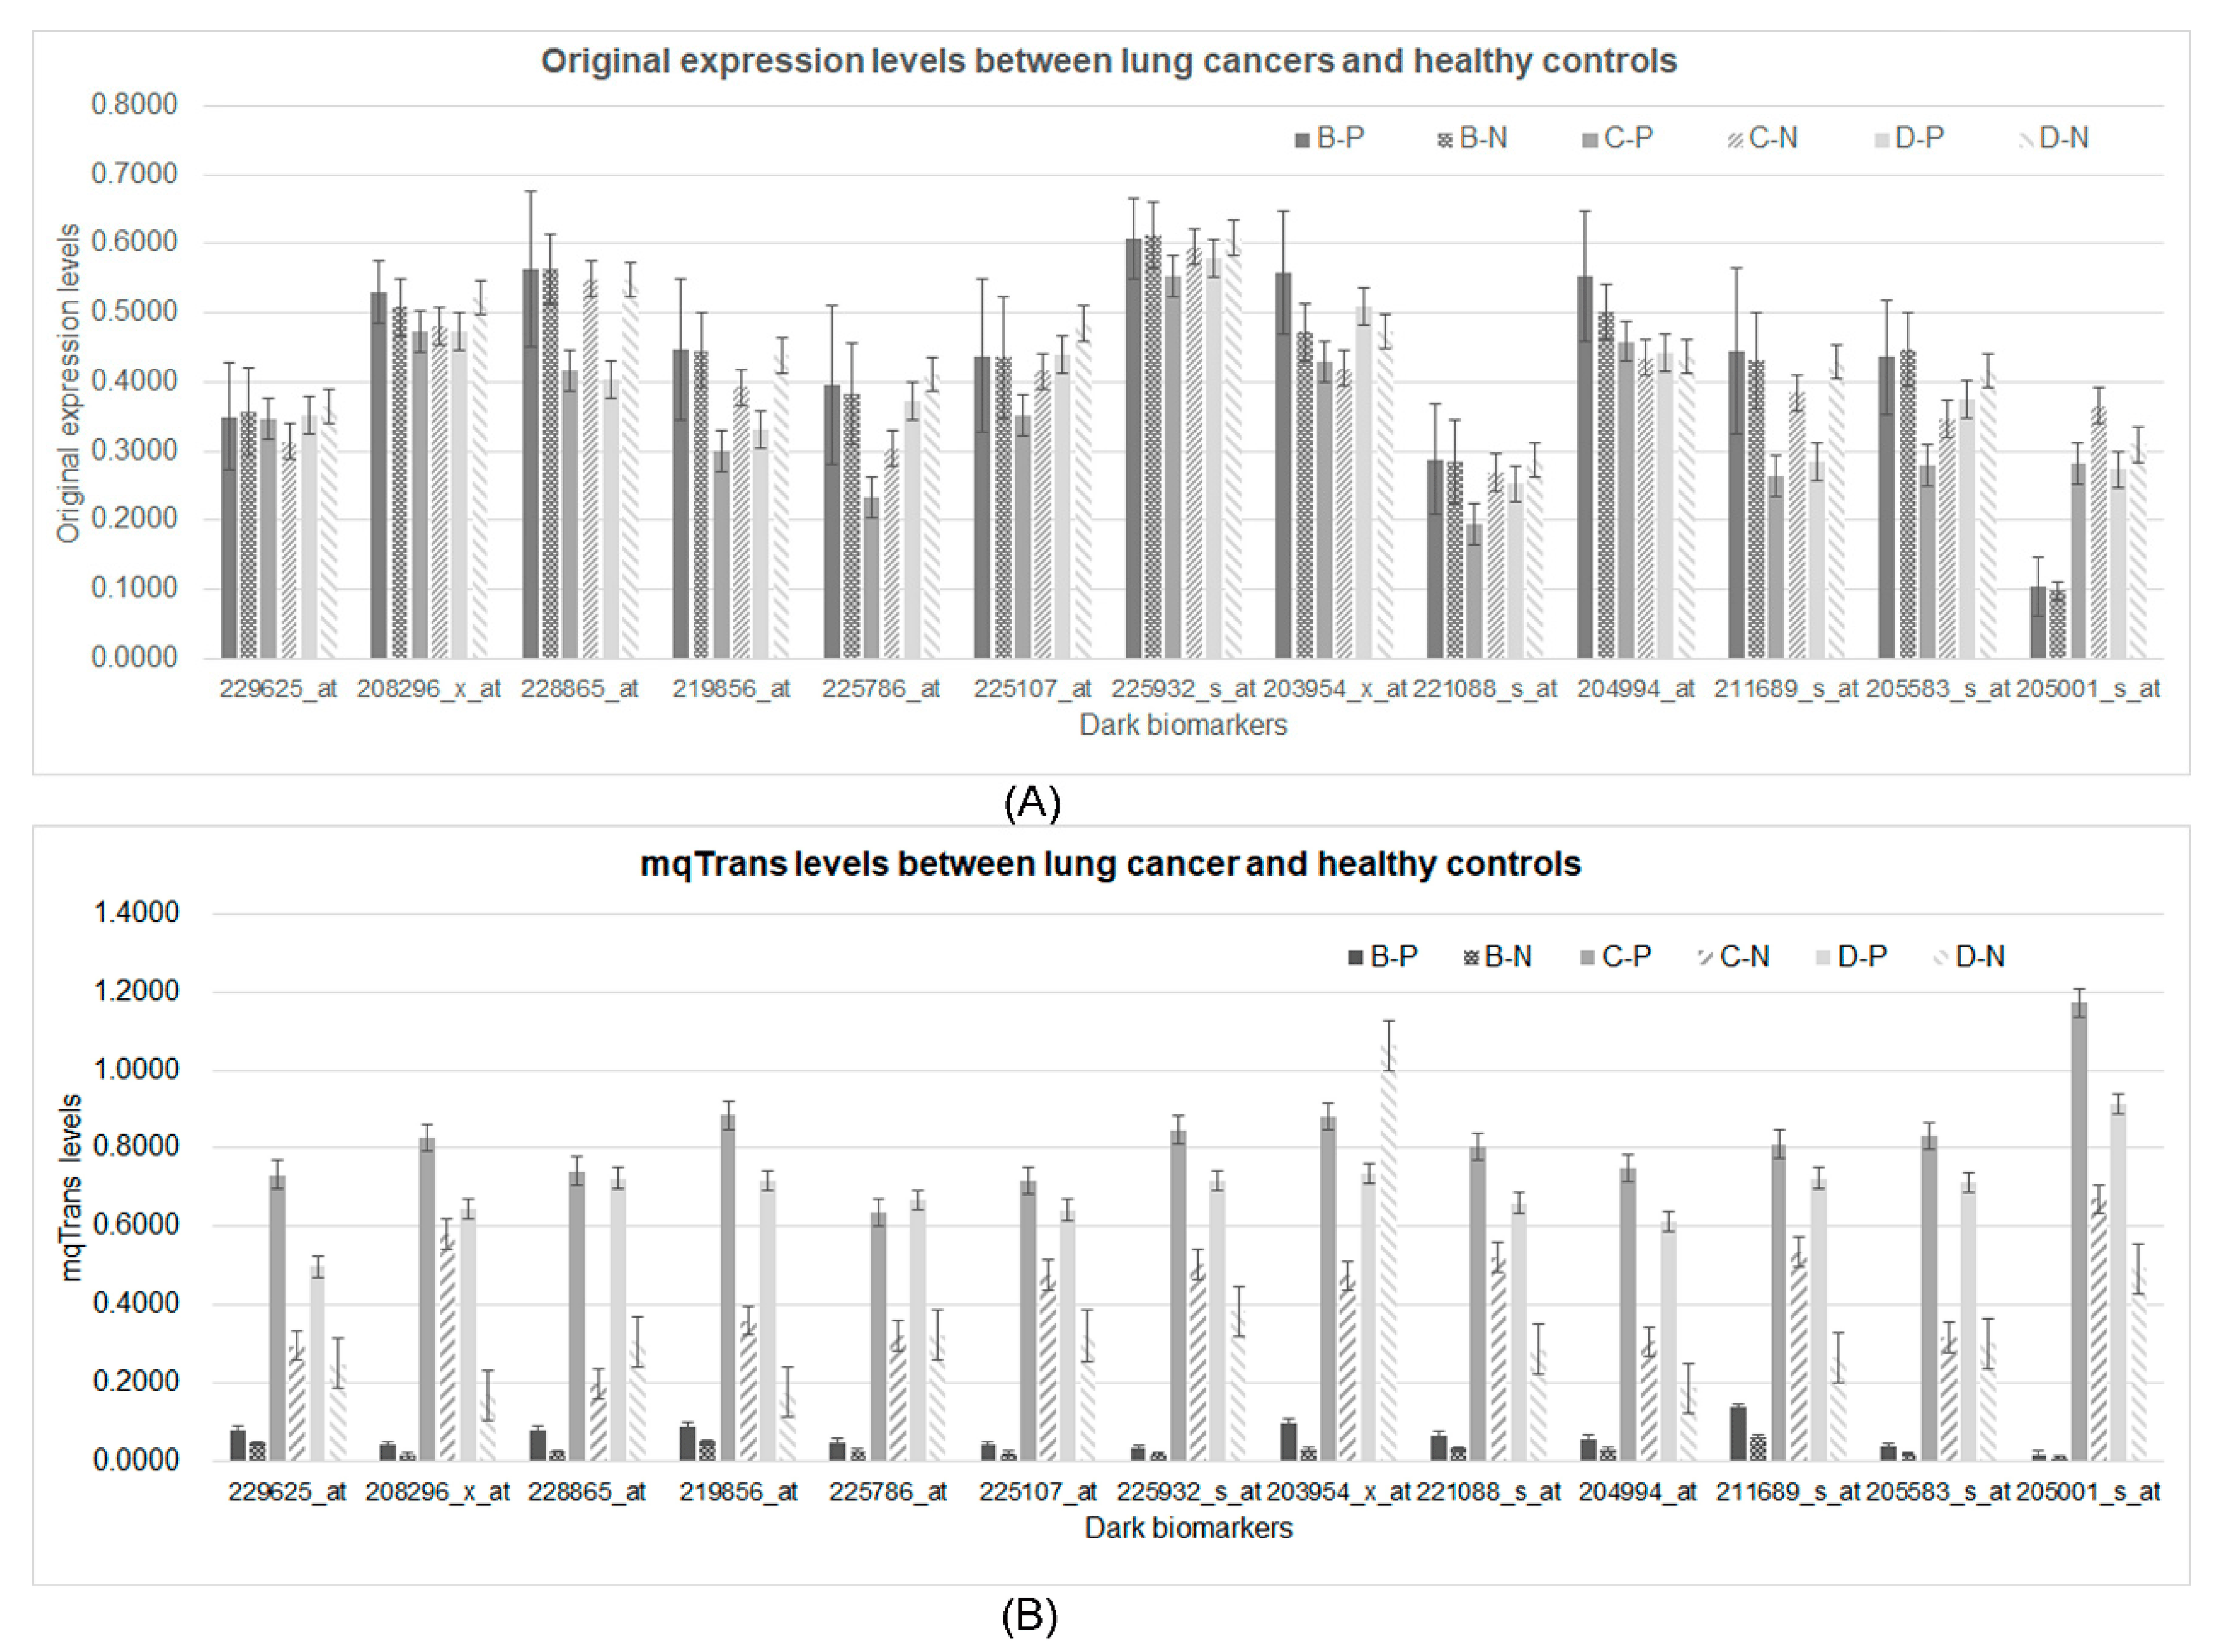
Figure 5. Comparison of the 13 dark biomarkers from both the original expression and mqTrans levels. (A) The original expression levels and (B) the mqTrans levels of these 13 dark biomarkers are displayed. The two strong dark biomarkers are on the left-most part. The horizontal axis lists the 13 dark biomarkers. The vertical axis illustrates the values of the respective feature levels. The data series B-P and B-N are the lung cancer and healthy control samples in dataset B. The other four data series, C-P, C-N, D-P, and D-N, are defined for the lung cancer and healthy control samples in datasets C and D, respectively.
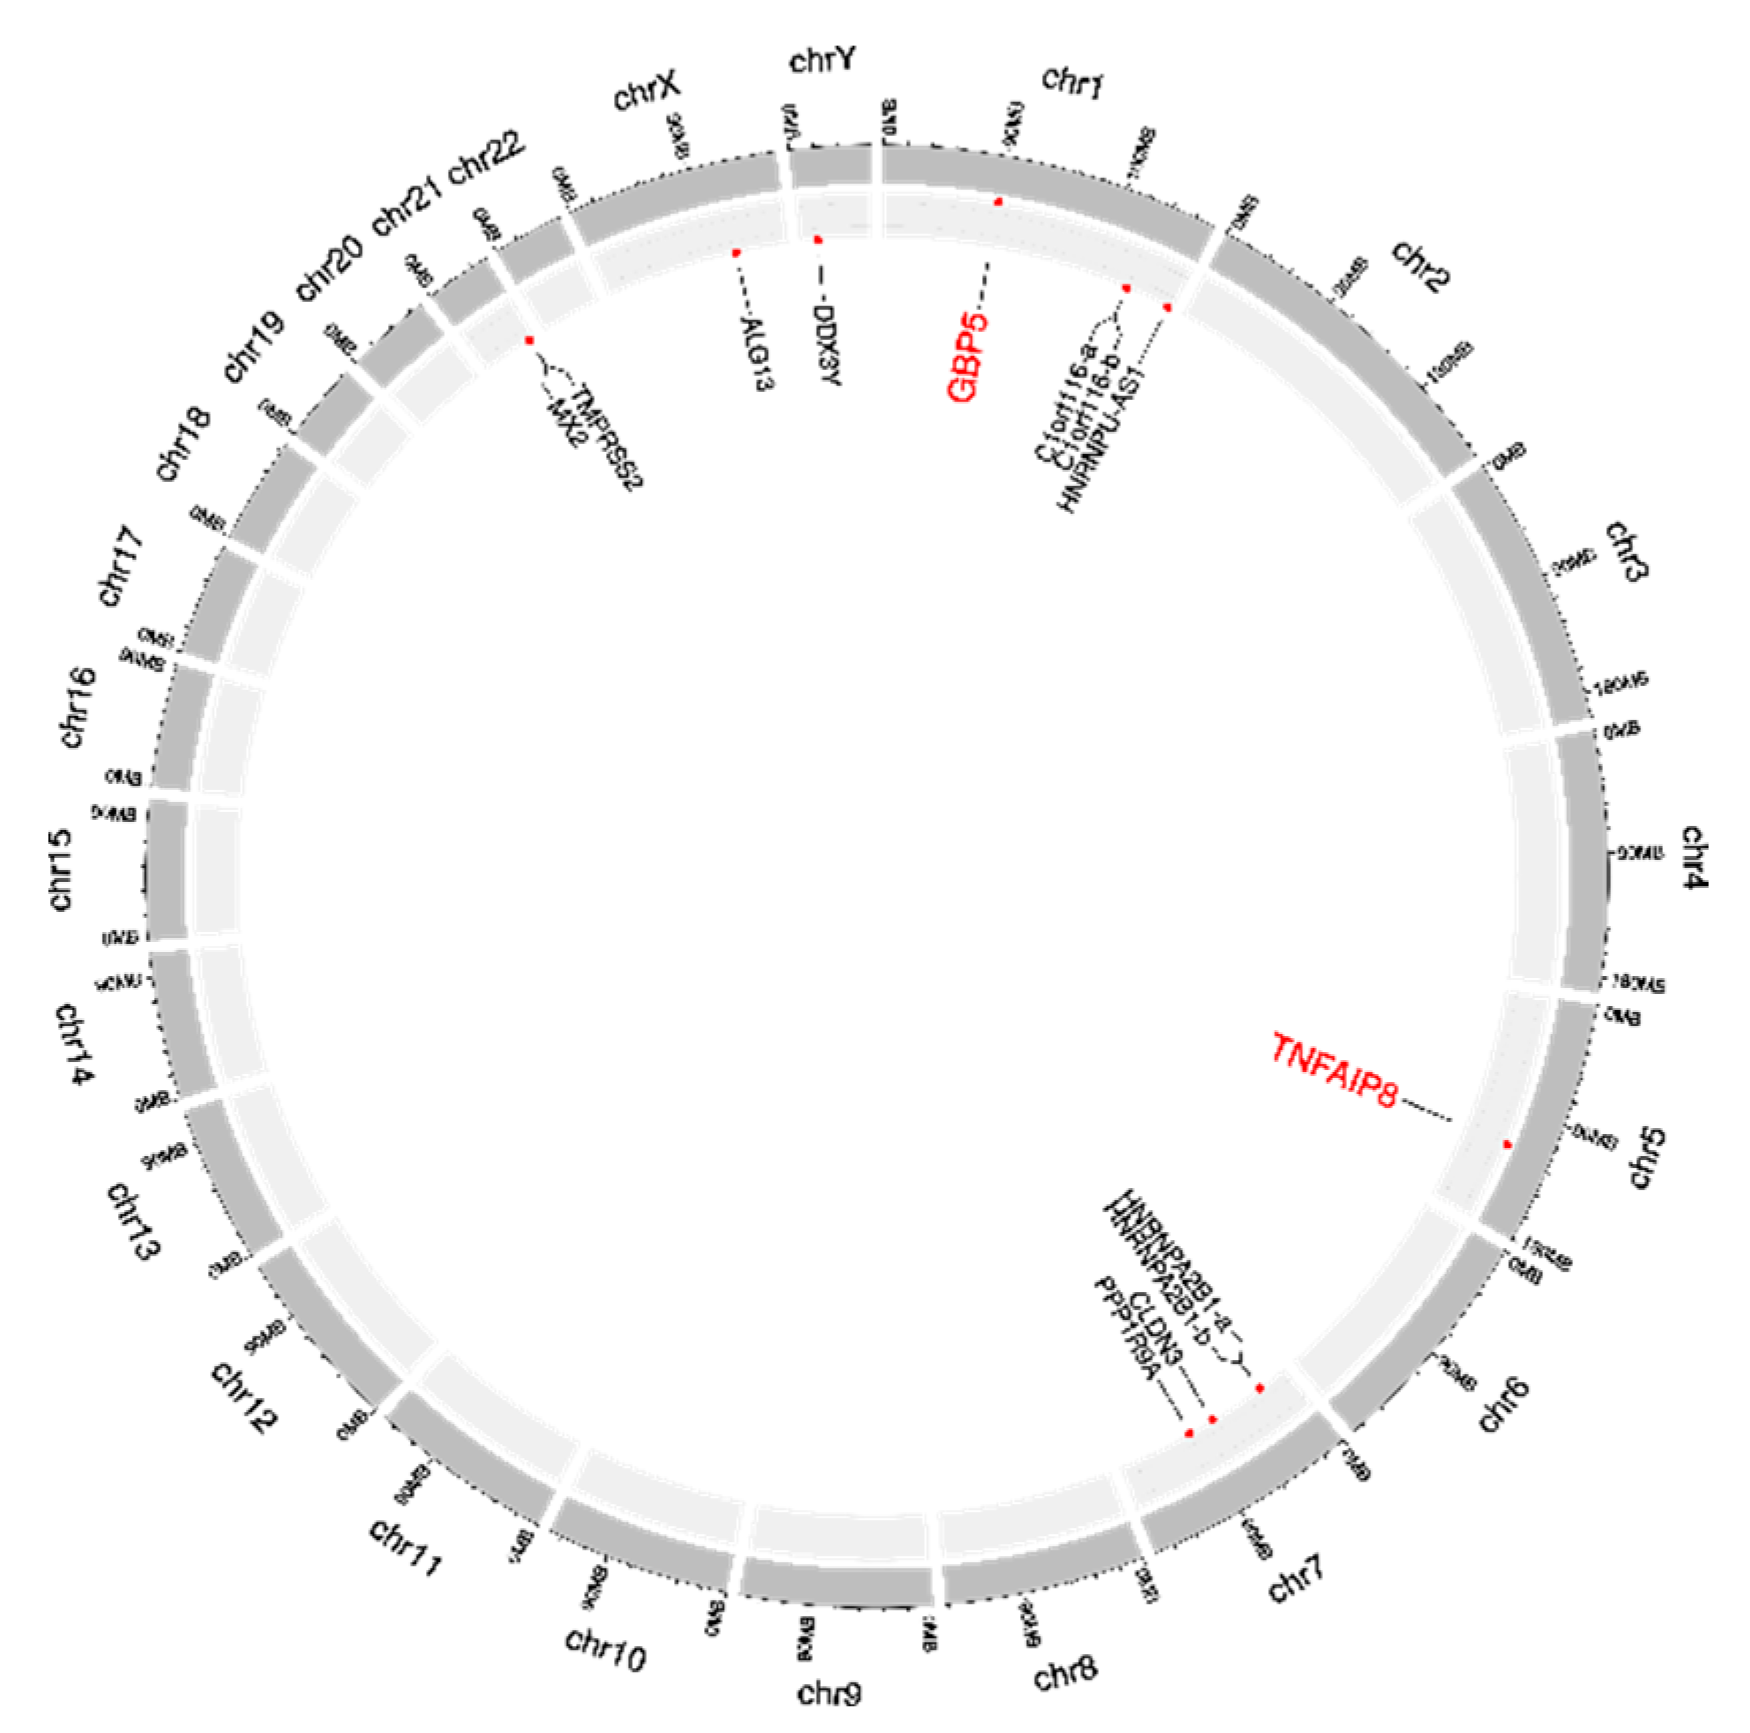
Figure 6. Circos plot of the 13 dark biomarkers in the human genome. The dark biomarkers are represented with the genes where they reside. The two strong dark biomarkers 229625_at (gene GBP5) and 208296_x_at (gene TNFAIP8) are highlighted in a larger size and red color. The two dark biomarkers 228865_at and 219856_at are both within the gene C1orf116, and they are denoted as C1orf116-a and C1orf116-b, respectively. Another pair of dark biomarkers, 225107_at and 225932_s_at, are from gene HNRNPA2B1, and they are denoted as HNRNPA2B1-a and HNRNPA2B1-b, respectively. The Circos plot was generated using the online version of shinyCircos.
A large-scale evaluation of the expression patterns of the two strong dark biomarkers GBP5 and TNFAIP8 across different human organs was conducted . The GTEx Portal [46] visualized the gene expression profiles across most human organs, and illustrates that these two dark biomarkers, GBP5 and TNFAIP8, showed relatively high expression levels in the lung compared to the other organs. We further investigated how these two genes were expressed in different cancer types compared against their matched normal samples . The visualizations were retrieved from the GEPIA database [47] using the TCGA data [48]. Both strong dark biomarkers had increased expression levels in tumor samples of many cancer types, including DLBC (lymphoid neoplasm diffuse large B-cell lymphoma), GBM (glioblastoma multiforme), OV (ovarian serous cystadenocarcinoma), PAAD (pancreatic adenocarcinoma), SARC (sarcoma), and TGCT (testicular germ cell tumors). But, GBP5 and TNFAIP8 were expressed at similar levels between the tumor and normal samples in the two lung cancer subtypes LUAD (lung adenocarcinoma) and LUSC (lung squamous-cell carcinoma), which confirmed our computational analysis results.
Figure 7 illustrates the dot plots of the lung cancer and healthy control samples on the original expression and mqTrans levels. The original expression levels of these 13 features did not separate the lung cancer samples from the healthy controls. But, the top two principal components [49] based on the 13 corresponding mqTrans features clearly separated the lung cancer samples from the healthy controls. Figure 7 indicates that useful information is carried by these dark biomarkers which might be ignored in a conventional differential analysis.
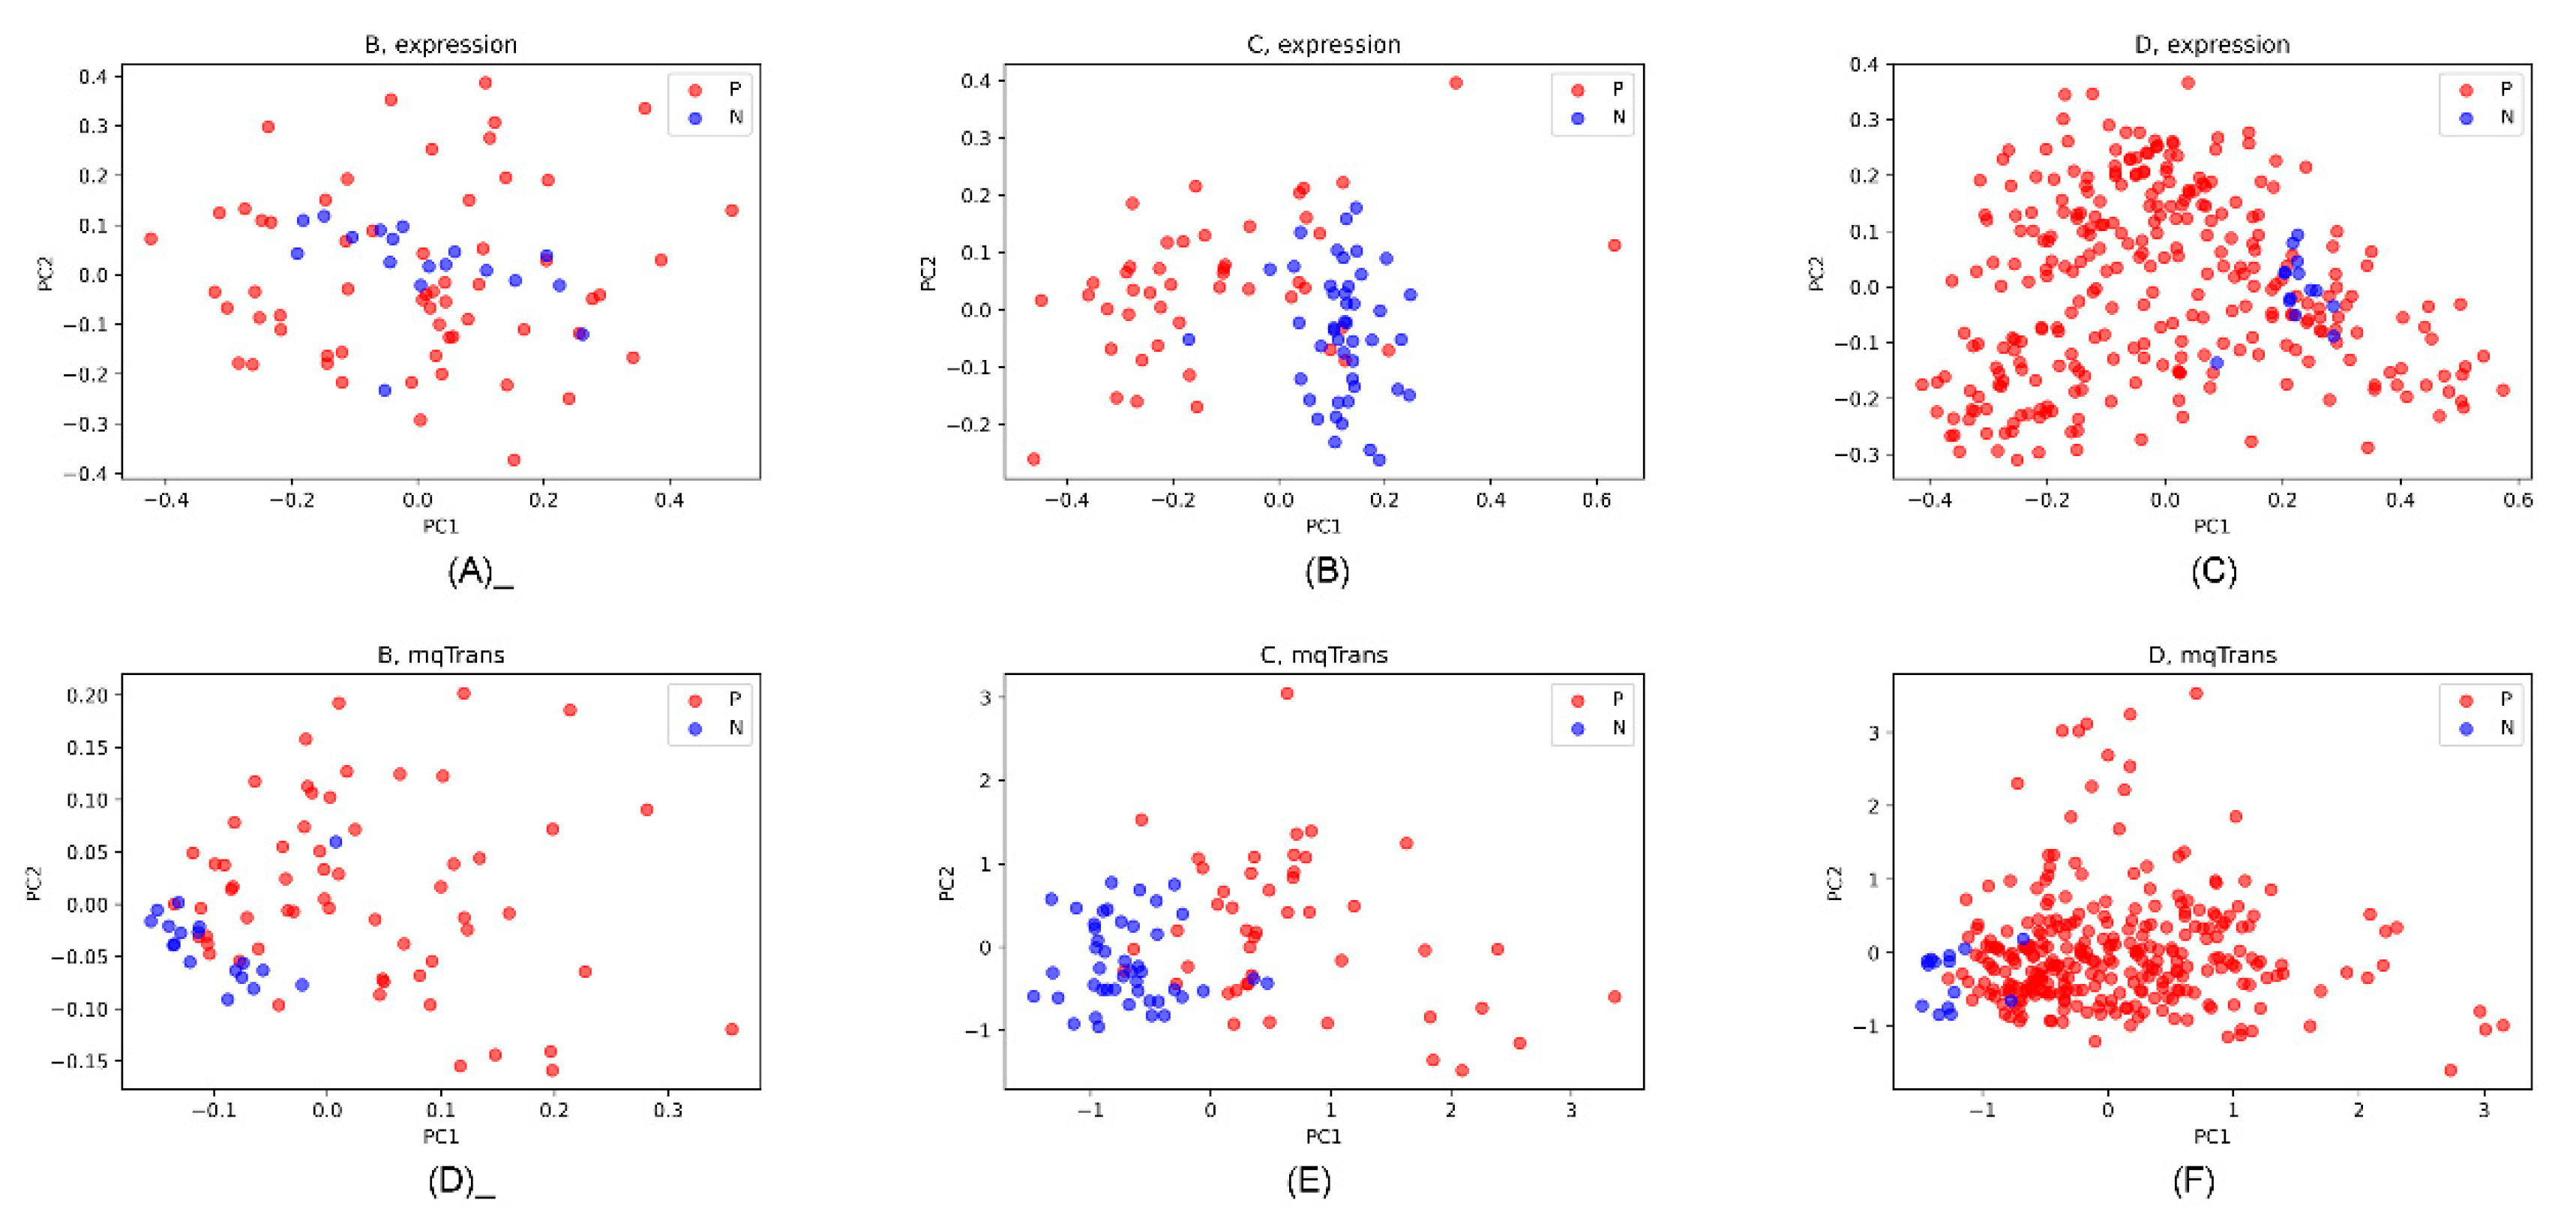
Figure 7. PCA dot plots of the 13 dark biomarkers on the original expression and mqTrans levels in the three datasets. The first and second principal components (PC1 and PC2) are used as the horizontal and vertical axis. The lung cancer and healthy control samples are colored as red (P) and blue (N). The PCA dot plots of the original expression levels are for datasets (A) B, (B) C, and (C) D. The PCA dot plots of the mqTrans levels are also generated for the three datasets (D) B, (E) C, and (F) D.
3.6. Validation of the Dark Biomarkers on an Independent Dataset
We conducted an additional validation experiment of the detected dark biomarkers in independent datasets. A comprehensive screening was carried out for the lung cancer datasets in the GEO database [24]. We found four new GPL570-based datasets with at least 100 samples, i.e., GSE115458, GSE18385, GSE33532, and GSE19188. Datasets GSE115458 and GSE18385 had no normal control samples. Dataset GSE33532 consisted of only twenty patients with diagnosed early-stage non-small-cell lung cancer (NSCLC), and each patient had four tumor sub-samples and one matched normal lung tissue sample. Therefore, we could only obtain one independent validation dataset, GSE19188.
The same mqTrans protocol confirmed the three dark biomarkers in using the independent validation dataset GSE19188. The strong dark biomarker 229625_at (gene symbol: GBP5) showed a significant association (mqTrans-p = 3.54 × 10⁻³) with lung cancer in dataset GSE19188, while its original expression maintained very stable expression levels with a p-value = 0.9113 between the two groups of lung cancer and control samples. The weak dark biomarker 203954_x_at (gene symbol: CLDN3) also showed stable expression levels (p-value = 0.6916) between the lung cancer and control samples, while its mqTrans values were significantly associated with lung cancer (mqTrans-p = 4.34 × 10⁻³). The other weak dark biomarker 204994_at (gene symbol: MX2) had similar patterns in the dataset.
3.7. Biological Observation of the Strong Dark Biomarker GBP5
The strong dark biomarker GBP5 encodes the Guanylate-Binding Protein 5 [50] and is actively involved in the innate immune system and the interferon γ signaling pathway [51]. GBP5 was recently observed to be significantly differentially expressed in liver cells under different interferon γ treatments and may potentially facilitate the finding of effective treatment for the Hepatitis B Virus (HBV) [52]. Recent studies also found that GBP5, together with a few other genes, served as an ideal and stable diagnosis biomarker set for pulmonary tuberculosis (TB) [53].
Although no literature supported any connections between GBP5 and lung cancer, its co-transcribed paralog GBP1 was observed to be involved in lung adenocarcinoma (LUAD). Yamakita et al. experimentally demonstrated that GBP1 facilitated the metastasis process of LUAD and that its expression needed to be actively repressed to control the LUAD’s progression [54]. The resistance to the first-line erlotinib treatment of LUAD might be promoted by the up-regulated GBP1 expression [55]. The close correlation of GBP1 with advanced LUAD’s profiles was successfully utilized in the prognosis prediction and management of LUAD patients [55].
A curation of the long non-coding RNAs’ overlapping with the 13 dark biomarker features was collected from the LncBook database [56] (the phenotype “Lung cancer” in ). GBP5 has an antisense long non-coding RNA (lncRNA), HSALNG0005054, without detailed investigations in the literature. HSALNG0005054 was only transcribed in infant (after 18 weeks) and elderly livers and had no detectable expression in newborn or adolescent livers [57]. No expression was detected in the development of the other six organs. The data suggested that this lncRNA was under a precise transcription regulation of its functions.
This study analyzed three independent datasets to show that the expression levels of GBP5 did not show differential expression in lung cancer but that its quantitative correlations with its upstream TFs were significantly altered. Combined with the above observations in the literature, how GBP5 is involved in the onset of lung cancer might be worth further experimental investigations.
3.8. RNA-Seq Dark Biomarkers of Late-Stage LUAD and LUSC
We evaluated the proposed mqTrans protocol on the dark biomarkers of late-stage lung cancer using the RNA-seq transcriptomes from The Caner Genome Atlas (TCGA) database [48]. Due to the fact that the number of control samples is extremely small in the TCGA database, this section focused on the two classes of early- and late-stage lung cancer. The two subtypes lung adenocarcinoma (LUAD) and lung squamous-cell carcinoma (LUSC) of lung cancer were used for the evaluation. Stages I and II were denoted as early-stage lung cancer, and stages III and IV were the late-stage cancer samples. Only the samples with annotations of the stages I/II/III/IV were used for the analysis in this section. We randomly extracted 70% of the early-stage samples to train the regression models and conducted a Kaplan–Meier (KM) survival analysis based on the original expression and the mqTrans values of the detected dark biomarkers of each lung cancer subtype [58].
shows that fourteen and two dark biomarkers were detected for the late-stage LUAD and LUSC samples, respectively. Their overlapping lncRNAs are listed in the phenotypes “Late LUAD” and “Late LUSC” in . The transcription regulation of these 16 dark biomarkers was significantly altered in the late-stage lung cancer samples, while their original expression levels remained unchanged compared to the early-stage samples. It is interesting to observe that the novel transcript ENSG00000267249 (gene symbol: RP11-973H7.3) maintained very stable expression levels (raw-p = 0.4012) between the early- and late-stage LUAD samples, while it showed significantly different mqTrans values (mqTrans-p = 8.28 × 10⁻⁴). ENSG00000267249 also showed very stable expression levels across different human organs, while it was highly expressed in the brain cerebellar hemisphere and the brain cerebellum based on the UCSC Genome Browser [59]. This gene had no orthologs across rats, zebrafish, and flies. So, ENSG00000267249 might be a good candidate for the investigation of how human-specific lung adenocarcinoma develops, since this gene has received very limited attention in the literature.
We further investigated how the mqTrans features could improve the Kaplan–Meier (KM) survival analysis of lung cancer compared to the original expression levels of these dark biomarkers, as shown in Figure 8 and in . The KM analysis excluded the samples without death time and with missing values in these dark biomarker genes. We divided all the samples into high-risk or low-risk groups using the same method as in [58]. The KM survival analysis was conducted on the original expression levels and the mqTrans values of each dark biomarker gene. Figure 8 illustrates that the original expression levels of the novel transcript ENSG00000267249 had no capability in discriminating the high-risk and low-risk groups of LUAD patients (p = 0.7000), while its mqTrans values showed a much improved statistical significance (p = 0.0051) in discriminating the high-risk LUAD patients from the low-risk group. The statistical significance of the KM plot of this gene was on the same level as in [58]. Similar patterns may be found in the KM analysis of all the 16 detected dark biomarkers of lung cancer in .
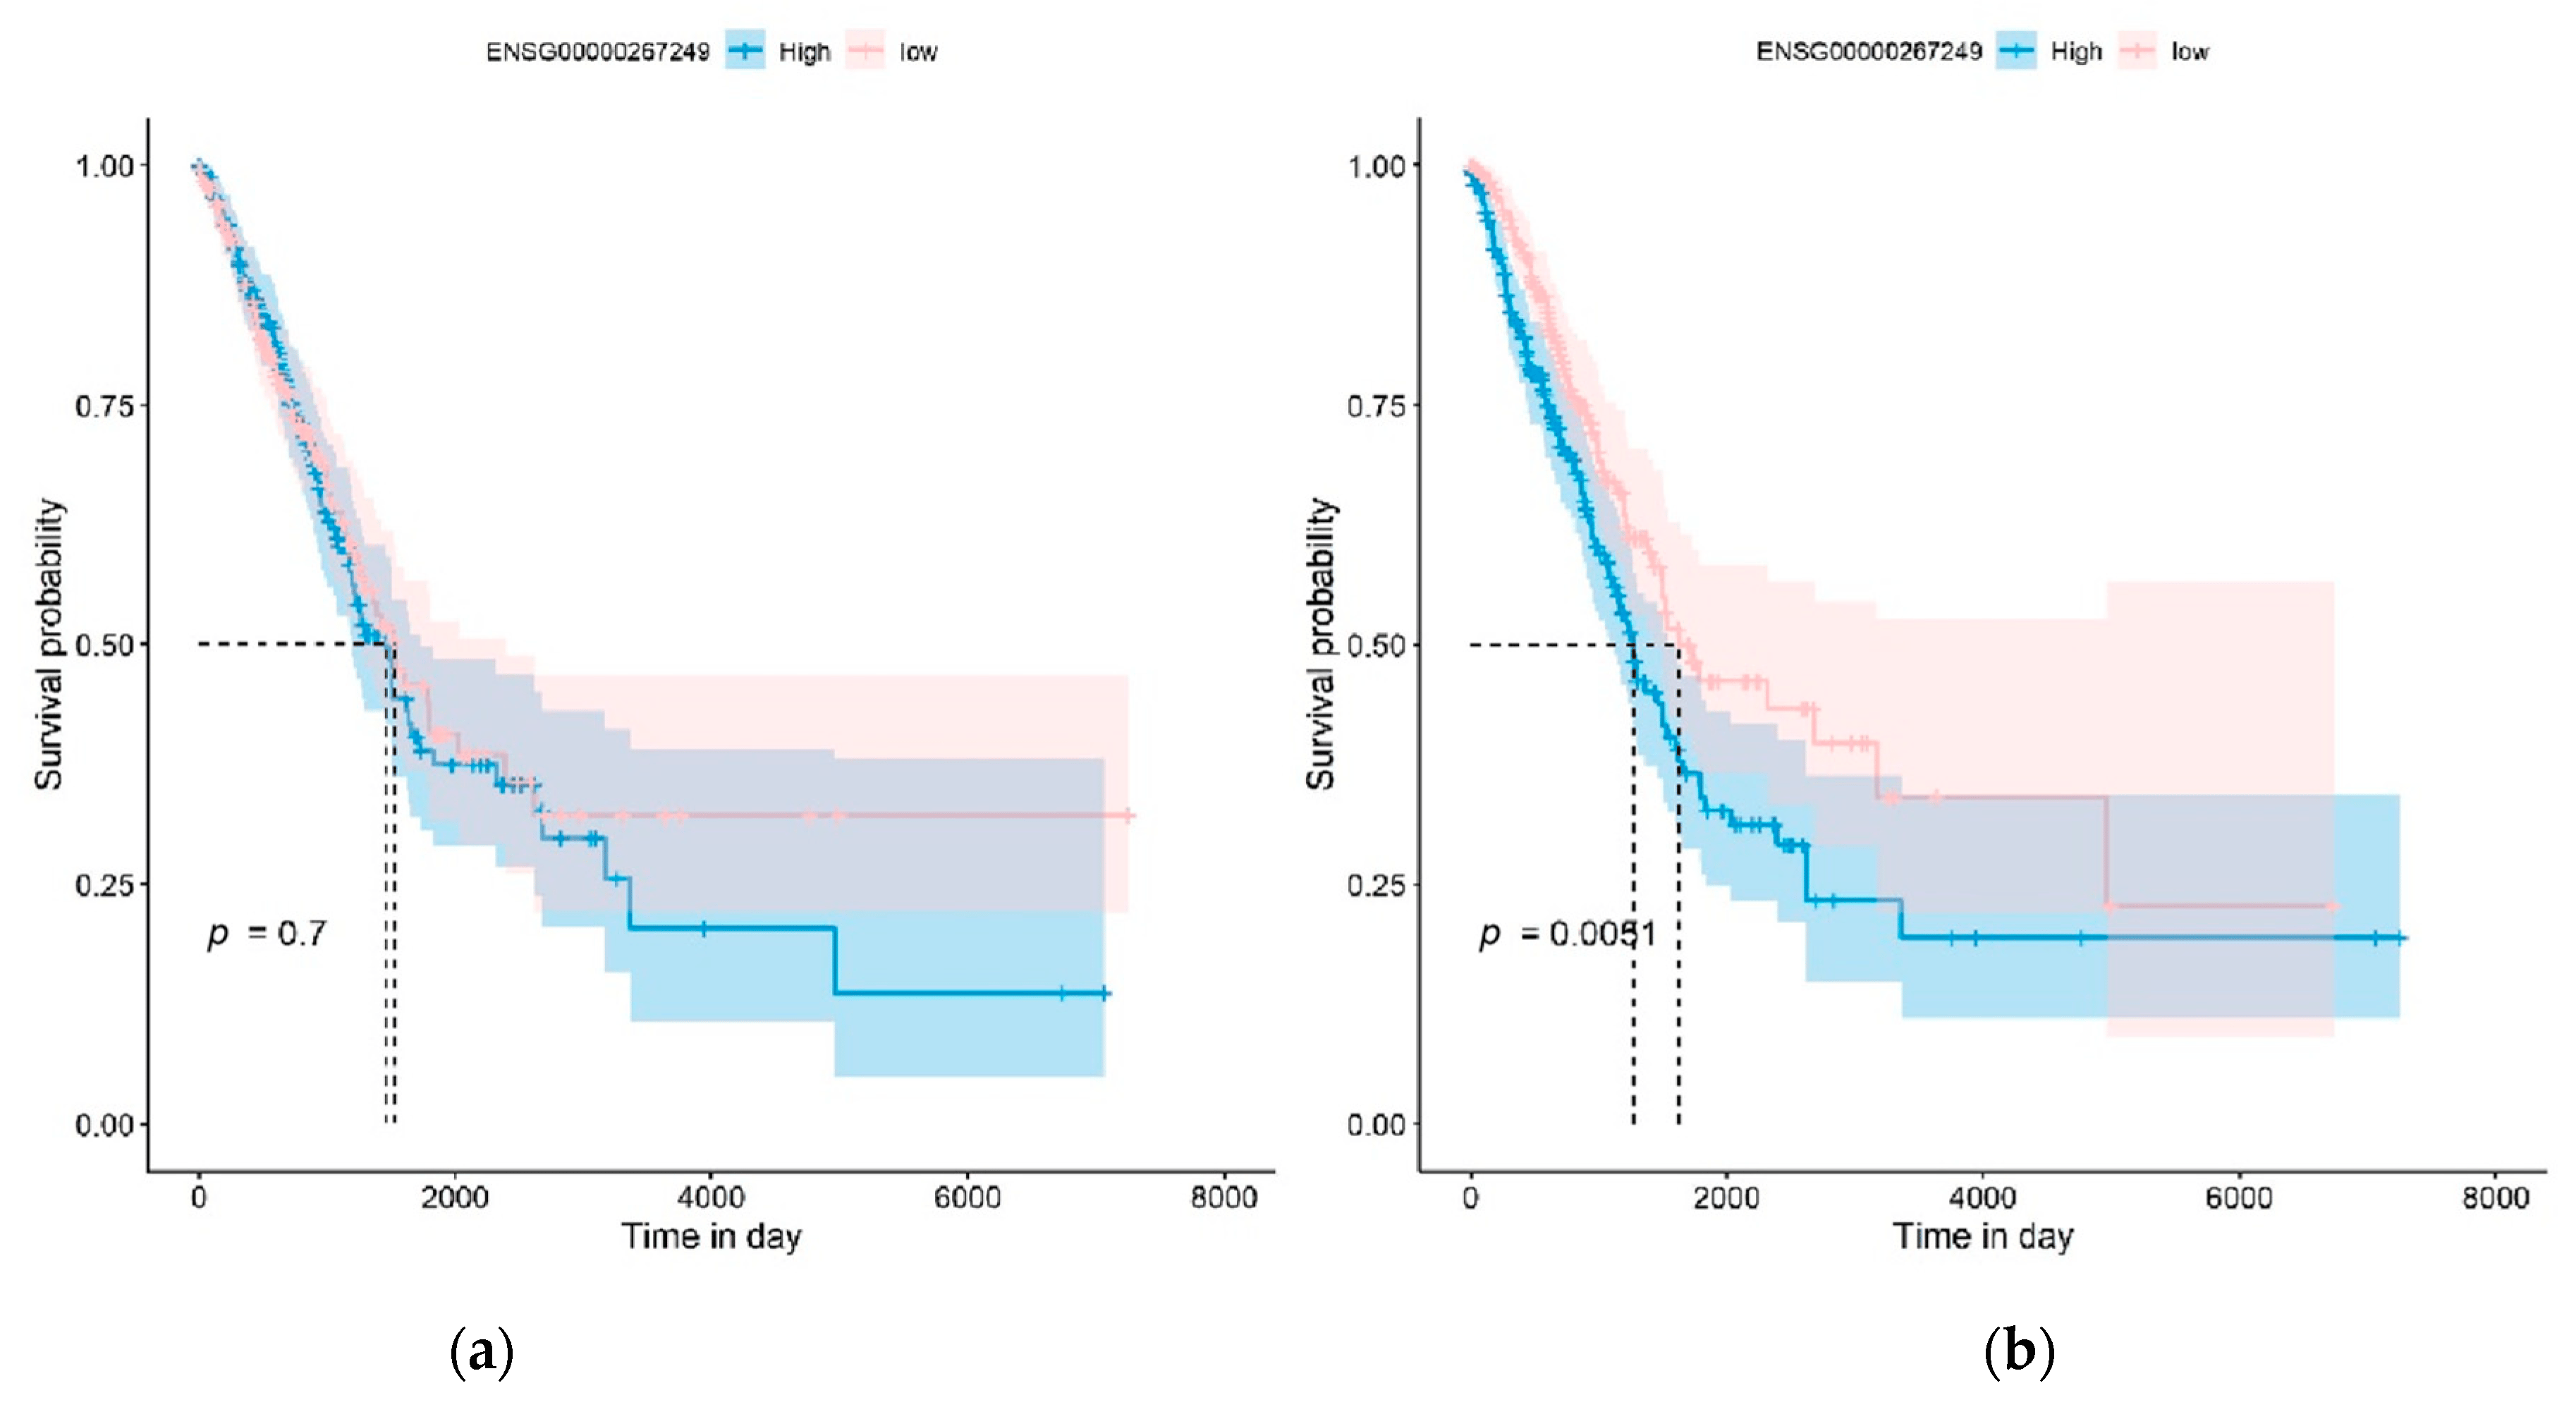
Figure 8. Kaplan–Meier (KM) survival analysis of the dark biomarker ENSG00000267249 (gene symbol: RP11-973H7.3) in the LUAD experiment. The KM plots of (a) the original expression levels and (b) the mqTrans values of this dark biomarker are generated for LUAD, respectively.
3.9. Overlapping lncRNAs Could Be a Disturbing Factor
Many genes overlapped with lncRNAs, and the transcripts of both an mRNA gene and its overlapping lncRNAs could not be easily discriminated. We collected the known lncRNAs overlapping with the detected dark biomarkers in the three experiments from the LncBook database [56] . We can see that most of the detected dark biomarkers have overlapping lncRNAs.
We took the gene STIM2 (Stromal Interaction Molecule 2) as an example. STIM2 was a dark biomarker associated with late-stage LUAD and overlapped with one sense and three antisense lncRNAs, as shown in . The LncBook database proposed a novel approach to calculate the expression levels of some lncRNAs whose transcripts were discriminable from the overlapping genes [56]. The lncRNA HSALNG0033503 resided completely within the region of STIM2, and it had medium expression levels in 42.14% of the 337 biological conditions in the LncBook database. The three antisense lncRNAs, HSALNG0033504, HSALNG0033505, and HSALNG0033510, also showed a recognizable expression in many biological conditions. Considering the technical limitations of many existing expression calculation approaches, we proposed that the lncRNAs overlapping with an mRNA gene might have contributed transcripts disturbing the precise determination of this gene’s expression level.
4. Conclusions
This study proposed a computational protocol for analyzing transcriptomes from the view of high-dimensional inter-feature correlations. The mqTrans regression models employed also ensured the explainability of the engineered features. The demonstrative experiment detected two strong dark biomarkers and eleven additional weak dark biomarkers of lung cancer. These dark biomarkers showed no differential expression in at least one of the three independent datasets and, therefore, could be ignored in a conventional differential expression analysis. But, all these 13 dark biomarkers showed a significantly differential expression from the view of the mqTrans features.
We recognize the possibility of new transcription factors involved in the regulation of gene expression in a disease state. The models we have built are specific sets of transcription factors obtained with learning in healthy samples and used to predict the expression of the corresponding mRNA genes in a disease state. If new transcription factors emerge in the disease state and our model does not integrate these new factors, the prediction will be highly biased. We believe is the following to be one of the important contributions of our study: although the original expression of an mRNA gene may maintain similar values across diseased and healthy samples via different TF combinations, the mqTrans values are calculated based on the reference transcriptional regulatory network trained on the healthy samples and will change substantially in the disease samples, with new TFs for the corresponding mRNA genes.
A dark biomarker was not differentially expressed between the two groups of lung cancer and control samples, while the quantitative measurement of its transcription regulation showed a statistically significant differential expression in the lung cancer samples compared to the control group. Our detailed discussion of the strong dark biomarker GBP5 suggested that the overlapping lncRNAs might have contributed to this interesting phenomenon. provides additional evidence that many dark biomarkers have overlapping lncRNAs on both sense and antisense strands. Due to the inherent nature of microarray- and RNA-seq-based transcriptome profiling technologies, it is difficult to determine whether a detected transcript came from the mRNA or the lncRNA residing in the overlapping region. Therefore, the undifferential expression of an mRNA might consist of the transcripts of both the mRNA and the lncRNAs overlapping in the same region. Our mqTrans protocol provided a complementary way to detect these dark biomarkers that would otherwise be ignored in a conventional differential expression analysis.
We extend our analysis to single-cell RNA-seq (scRNA) datasets. The scRNA technology has recently emerged as a popular transcriptomic view to investigate the phenotypes of microbes, plants, and animals [60]. Two subsets of the GSE190725 study were used to compare the mqTrans analyses of both the bulk and single-cell RNA-seq data, i.e., endocrine cells and endocrine progenitor cells [61]. shows that the scRNA dark biomarkers are slightly fewer than the bulk RNA-seq dark biomarkers. Additionally, there are only four and seven dark biomarker genes supported by both the single-cell and bulk RNA-seq data for the endocrine cells and the endocrine progenitor cells, respectively. This suggests that an mqTrans analysis does not work well on scRNA data and may need further tuning to account for the characteristics of single-cell data.
The detection of dark biomarkers serves as an important and complementary analysis to the traditional differential expression analysis of transcriptomic biomarkers. Firstly, a traditional differential expression analysis detected 12593 biomarkers (p-values < 0.05) from the three datasets B/C/D and ignored 72.49% of the transcriptomic features. The mqTrans analysis can detect dark biomarkers with differential representations of lung cancer from the features ignored in a traditional biomarker analysis. Secondly, the mqTrans analysis provides supporting evidence for the protein-level phenotype associations of dark biomarkers without differential expression in wet-lab studies. The YTH N6-Methyladenosine RNA-binding protein C2 (YTHDC2) is an RNA-modification 6-methyladenine (m6A) reader [62] and was detected as the dark biomarker gene of metastatic colon cancer (mCC) [63]. Liu et al. observed that multiple m6A RNA methylation regulators showed differential expression in cancers except for YTHDC2 [64], and Tanabe et al. filled the gap with immunohistochemistry technology, showing that YTHDC2 is positively correlated with mCC on its protein levels [65]. Thirdly, some dark biomarkers show comparable expression levels to traditional biomarkers and merit further wet-lab investigations. Yoshimura et al. identified CD200 and CD200R1 as the differentially expressed biomarkers of lung cancer [66], while shows that the two strong dark biomarkers have similar or higher expression levels compared to CD200 and CD200R1.
The proposed mqTrans protocol has a number of limitations to be resolved in future studies. Firstly, the computational analysis showed the altered transcription regulation of the dark biomarkers, and in vitro or in vivo investigations could be worth conducting on the possible interference of the expression of the long non-coding RNAs overlapping with these dark biomarkers. Secondly, regression was the main module of the mqTrans protocol and may be improved with feature selection algorithms and deep learning algorithms.
In future studies, we will consider how to further refine the model to include potential new transcription factors and continuously improve the accuracy and robustness of the predictions. Different metrics like PCC and RMSE will also be evaluated to determine the measurement between the predicted values and the original levels of a given mRNA gene. The mqTrans analysis of various transcriptionally regulated targets like mRNA, lncRNA, and microRNA (miRNA) in different cancer types and other diseases remains largely unexplored and to be validated with wet-lab evidence.
References
- Alberg, A.J.; Samet, J.M. Epidemiology of lung cancer. Chest 2008, 3, 592. [Google Scholar]
- Ren, Y.; Zhao, S.; Jiang, D.; Xin, F.; Zhou, F. Proteomic biomarkers for lung cancer progression. Biomark. Med. 2018, 12, 205. [Google Scholar] [CrossRef] [PubMed]
- Gainor, J.F.; Tan, D.; Pas, T.D.; Solomon, B.J.; Ahmad, A.; Lazzari, C.; Marinis, F.D.; Spitaleri, G.; Schultz, K.; Friboulet, L. Progression-Free and Overall Survival in ALK-Positive NSCLC Patients Treated with Sequential Crizotinib and Ceritinib. Clin. Cancer Res. 2016, 21, 2745–2752. [Google Scholar] [CrossRef] [PubMed]
- Whang-Peng, J.; Bunn, P.; Kao-Shan, C.S.; Lee, E.C.; Minna, J.D. A nonrandom chromosomal abnormality, del 3p(14-23), in human small cell lung cancer (SCLC). Cancer Genet. Cytogenet. 1982, 6, 119–134. [Google Scholar] [CrossRef] [PubMed]
- Molinier, O.; Goupil, F.; Debieuvre, D.; Auliac, J.B.; Jeandeau, S.; Lacroix, S.; Martin, F.; Grivaux, M. Five-year survival and prognostic factors according to histology in 6101 non-small-cell lung cancer patients. Respir. Med. Res. 2020, 77, 46–54. [Google Scholar] [CrossRef] [PubMed]
- Li, J.; Li, H.; Zhang, C.; Zhang, C.; Wang, H. Integrative analysis of genomic alteration, immune cells infiltration and prognosis of lung squamous cell carcinoma (LUSC) to identify smoking-related biomarkers. Int. Immunopharmacol. 2020, 89, 107053. [Google Scholar] [CrossRef] [PubMed]
- Chen, M.; Liu, X.; Jie, D.; Wang, X.J.; Xia, L. Differentiated regulation of immune-response related genes between LUAD and LUSC subtypes of lung cancers. Oncotarget 2017, 8, 133–144. [Google Scholar] [CrossRef]
- Gyoba, J.; Shan, S.; Roa, W.; Bédard, E.L.R. Diagnosing Lung Cancers through Examination of Micro-RNA Biomarkers in Blood, Plasma, Serum and Sputum: A Review and Summary of Current Literature. Int. J. Mol. Sci. 2016, 17, 494. [Google Scholar] [CrossRef]
- Syeda, Z.A.; Langden, S.; Munkhzul, C.; Lee, M.; Song, S.J. Regulatory Mechanism of MicroRNA Expression in Cancer. Int. J. Mol. Sci. 2020, 21, 1723. [Google Scholar] [CrossRef]
- Berman, C.G.; Clark, R.A. Diagnostic imaging in cancer. Prim. Care 1992, 19, 677–713. [Google Scholar] [CrossRef]
- Oleksowicz, L.; Morris, J.C.; Phelps, R.G.; Bruckner, H.W. Pulmonary carcinoid presenting as multiple subcutaneous nodules. Tumori 1990, 76, 44–47. [Google Scholar] [CrossRef] [PubMed]
- Huber, A.; Landau, J.; Ebner, L.; Bütikofer, Y.; Leidolt, L.; Brela, B.; May, M.; Heverhagen, J.; Christe, A. Performance of ultralow-dose CT with iterative reconstruction in lung cancer screening: Limiting radiation exposure to the equivalent of conventional chest X-ray imaging. Eur. Radiol. 2016, 26, 3643–3652. [Google Scholar] [CrossRef] [PubMed]
- Bashir, A.; Gray, M.L.; Hartke, J.; Burstein, D. Nondestructive imaging of human cartilage glycosaminoglycan concentration by MRI. Magn. Reson. Med. 2015, 41, 857–865. [Google Scholar] [CrossRef]
- Pelosi, G.; Sonzogni, A.; Veronesi, G.; Camilli, E.D.; Maisonneuve, P.; Spaggiari, L.; Manzotti, M.; Masullo, M.; Taliento, G.; Fumagalli, C. Pathologic and molecular features of screening low-dose computed tomography (LDCT)-detected lung cancer: A baseline and 2-year repeat study. Lung Cancer 2008, 62, 202–214. [Google Scholar] [CrossRef] [PubMed]
- Morigi, J.J.; Stricker, P.D.; Leeuwen, P.V.; Tang, R.; Ho, B.; Nguyen, Q.; Hruby, G.; Fogarty, G.; Jagavkar, R.; Kneebone, A. Prospective Comparison of 18F-Fluoromethylcholine Versus 68Ga-PSMA PET/CT in Prostate Cancer Patients Who Have Rising PSA after Curative Treatment and Are Being Considered for Targeted Therapy. J. Nucl. Med. 2015, 56, 1185–1190. [Google Scholar] [CrossRef] [PubMed]
- Klein, A.; Mazutis, L.; Akartuna, I.; Tallapragada, N.; Veres, A.; Li, V.; Peshkin, L.; Weitz, D.; Kirschner, M. Droplet barcoding for single-cell transcriptomics applied to embryonic stem cells. Cell 2015, 161, 1187–1201. [Google Scholar] [CrossRef]
- Barrett, T.; Wilhite, S.E.; Ledoux, P.; Evangelista, C.; Kim, I.F.; Tomashevsky, M.; Marshall, K.A.; Phillippy, K.H.; Sherman, P.M.; Holko, M. NCBI GEO: Archive for functional genomics data sets—Update. Nucleic Acids Res. 2013, 39, 1005–1010. [Google Scholar] [CrossRef]
- Filipowicz, W.; Bhattacharyya, S.N.; Sonenberg, N. Mechanisms of post-transcriptional regulation by microRNAs: Are the answers in sight? Nat. Rev. Genet. 2008, 9, 102–114. [Google Scholar] [CrossRef]
- Kulesza, D.W.; Carré, T.; Chouaib, S.; Kaminska, B. Silencing of the transcription factor STAT3 sensitizes lung cancer cells to DNA damaging drugs, but not to TNFα- and NK cytotoxicity. Exp. Cell Res. 2013, 319, 506–516. [Google Scholar] [CrossRef]
- Zheng, W.P.; Flavell, R.A. The transcription factor GATA-3 is necessary and sufficient for Th2 cytokine gene expression in CD4 T cells. J. Immunol. 2016, 196, 4426–4435. [Google Scholar] [CrossRef]
- Ahmed, H.A.; Nada, O. E2F3 transcription factor: A promising biomarker in lung cancer. Cancer Biomark. 2017, 19, 21–26. [Google Scholar] [CrossRef] [PubMed]
- Duan, M.; Song, H.; Wang, C.; Zheng, J.; Zhou, F. Detection and Independent Validation of Model-Based Quantitative Transcriptional Regulation Relationships Altered in Lung Cancers. Front. Bioeng. Biotechnol. 2020, 8, 582. [Google Scholar] [CrossRef] [PubMed]
- Xin, R.; Feng, X.; Zhang, H.; Wang, Y.; Duan, M.; Xie, T.; Dong, L.; Yu, Q.; Huang, L.; Zhou, F. Seven non-differentially expressed ‘dark biomarkers’ show transcriptional dysregulation in chronic lymphocytic leukemia. Pers. Med. 2023, 20, 143–155. [Google Scholar] [CrossRef] [PubMed]
- Barrett, T.; Edgar, R. Mining microarray data at NCBI’s Gene Expression Omnibus (GEO)*. Methods Mol. Biol. 2006, 338, 175–190. [Google Scholar] [PubMed]
- Dinalankara, W.; Bravo, H.C. Gene Expression Signatures Based on Variability can Robustly Predict Tumor Progression and Prognosis. Cancer Inform. 2015, 14, 71. [Google Scholar] [CrossRef] [PubMed]
- Hu, H.; Miao, Y.R.; Jia, L.H.; Yu, Q.Y.; Zhang, Q.; Guo, A.Y. AnimalTFDB 3.0: A comprehensive resource for annotation and prediction of animal transcription factors. Nucleic Acids Res. 2019, 47, D33–D38. [Google Scholar] [CrossRef] [PubMed]
- Preacher, K.J.; Curran, P.J.; Bauer, D.J. Computational Tools for Probing Interactions in Multiple Linear Regression, Multilevel Modeling, and Latent Curve Analysis. J. Educ. Behav. Stat. 2006, 31, 437–448. [Google Scholar] [CrossRef]
- Deguines, N.; Brashares, J.S.; Prugh, L.R. Precipitation alters interactions in a grassland ecological community. J. Anim. Ecol. 2017, 86, 262–272. [Google Scholar] [CrossRef]
- Duan, M.; Liu, Y.; Zhao, D.; Li, H.; Zhang, G.; Liu, H.; Wang, Y.; Fan, Y.; Huang, L.; Zhou, F. Gender-specific dysregulations of nondifferentially expressed biomarkers of metastatic colon cancer. Comput. Biol. Chem. 2023, 104, 107858. [Google Scholar] [CrossRef]
- Duan, M.; Zhang, L.; Wang, Y.; Fan, Y.; Liu, S.; Yu, Q.; Huang, L.; Zhou, F. Computational pan-cancer characterization of model-based quantitative transcription regulations dysregulated in regional lymph node metastasis. Comput. Biol. Med. 2021, 135, 104571. [Google Scholar] [CrossRef]
- Diehr, P.; Martin, D.C.; Koepsell, T.; Cheadle, A. Breaking the matches in a paired t-test for community interventions when the number of pairs is small. Stat. Med. 2010, 14, 1491–1504. [Google Scholar] [CrossRef] [PubMed]
- Clement, E. Using Normalized Bayesian Information Criterion (Bic) to Improve Box-Jenkins Model Building. Am. J. Math. Stat. 2014, 4, 214–221. [Google Scholar] [CrossRef]
- Zhang, L.Q.; Li, Q.Z.; Su, W.X.; Jin, W. Predicting gene expression level by the transcription factor binding signals in human embryonic stem cells. Biosystems 2016, 150, 92–98. [Google Scholar] [CrossRef] [PubMed]
- Beer, M.A.; Tavazoie, S. Predicting gene expression from sequence. Cell 2004, 117, 185–198. [Google Scholar] [CrossRef] [PubMed]
- Shi, W.Q.; Fornes, O.; Wasserman, W.W. Gene expression models based on transcription factor binding events confer insight into functional cis-regulatory variants. Bioinformatics 2019, 35, 2610–2617. [Google Scholar] [CrossRef] [PubMed]
- Kelley, D.R.; Reshef, Y.A.; Bileschi, M.; Belanger, D.; McLean, C.Y.; Snoek, J. Sequential regulatory activity prediction across chromosomes with convolutional neural networks. Genome Res. 2018, 28, 739–750. [Google Scholar] [CrossRef]
- Zhang, D.; Xia, J. Somatic synonymous mutations in regulatory elements contribute to the genetic aetiology of melanoma. BMC Med. Genom. 2020, 13, 43. [Google Scholar] [CrossRef]
- Kim, M.; Haney, J.R.; Zhang, P.; Hernandez, L.M.; Wang, L.K.; Perez-Cano, L.; Loohuis, L.M.O.; de la Torre-Ubieta, L.; Gandal, M.J. Brain gene co-expression networks link complement signaling with convergent synaptic pathology in schizophrenia. Nat. Neurosci. 2021, 24, 799–809. [Google Scholar] [CrossRef]
- Tran, S.S.; Zhou, Q.; Xiao, X. Statistical inference of differential RNA-editing sites from RNA-sequencing data by hierarchical modeling. Bioinformatics 2020, 36, 2796–2804. [Google Scholar] [CrossRef]
- Wu, T.; Hu, E.; Xu, S.; Chen, M.; Guo, P.; Dai, Z.; Feng, T.; Zhou, L.; Tang, W.; Zhan, L.; et al. clusterProfiler 4.0: A universal enrichment tool for interpreting omics data. Innovation 2021, 2, 100141. [Google Scholar] [CrossRef]
- Szklarczyk, D.; Kirsch, R.; Koutrouli, M.; Nastou, K.; Mehryary, F.; Hachilif, R.; Gable, A.L.; Fang, T.; Doncheva, N.T.; Pyysalo, S.; et al. The STRING database in 2023: Protein-protein association networks and functional enrichment analyses for any sequenced genome of interest. Nucleic Acids Res. 2023, 51, D638–D646. [Google Scholar] [CrossRef] [PubMed]
- Kramer, E.D.; Tzetzo, S.L.; Colligan, S.H.; Hensen, M.L.; Brackett, C.M.; Clausen, B.E.; Taketo, M.M.; Abrams, S.I. β-Catenin signaling in alveolar macrophages enhances lung metastasis through a TNF-dependent mechanism. JCI Insight 2023, 8, e160978. [Google Scholar] [CrossRef] [PubMed]
- Lin, A.; Zhang, H.; Meng, H.; Deng, Z.; Gu, T.; Luo, P.; Zhang, J. TNF-α Pathway Alternation Predicts Survival of Immune Checkpoint Inhibitors in Non-Small Cell Lung Cancer. Front. Immunol. 2021, 12, 667875. [Google Scholar] [CrossRef] [PubMed]
- Paik, P.K.; Luo, J.; Ai, N.; Kim, R.; Ahn, L.; Biswas, A.; Coker, C.; Ma, W.; Wong, P.; Buonocore, D.J.; et al. Phase I trial of the TNF-α inhibitor certolizumab plus chemotherapy in stage IV lung adenocarcinomas. Nat. Commun. 2022, 13, 6095. [Google Scholar] [CrossRef] [PubMed]
- Yu, Y.; Ouyang, Y.; Yao, W. shinyCircos: An R/Shiny application for interactive creation of Circos plot. Bioinformatics 2018, 34, 1229–1231. [Google Scholar] [CrossRef] [PubMed]
- GTEx Consortium. The Genotype-Tissue Expression (GTEx) project. Nat. Genet. 2013, 45, 580–585. [Google Scholar] [CrossRef] [PubMed]
- Tang, Z.; Li, C.; Kang, B.; Gao, G.; Li, C.; Zhang, Z. GEPIA: A web server for cancer and normal gene expression profiling and interactive analyses. Nucleic Acids Res. 2017, 45, W98–W102. [Google Scholar] [CrossRef] [PubMed]
- The Cancer Genome Atlas Research Network; Weinstein, J.N.; Collisson, E.A.; Mills, G.B.; Shaw, K.R.; Ozenberger, B.A.; Ellrott, K.; Shmulevich, I.; Sander, C.; Stuart, J.M. The Cancer Genome Atlas Pan-Cancer analysis project. Nat. Genet. 2013, 45, 1113–1120. [Google Scholar] [CrossRef]
- Shariati-Rad, M.; Hasani, M. Principle component analysis (PCA) and second-order global hard-modelling for the complete resolution of transition metal ions complex formation with 1,10-phenantroline. Anal. Chim. Acta 2009, 648, 60–70. [Google Scholar] [CrossRef]
- Stelzer, G.; Rosen, N.; Plaschkes, I.; Zimmerman, S.; Twik, M.; Fishilevich, S.; Stein, T.I.; Nudel, R.; Lieder, I.; Mazor, Y.; et al. The GeneCards Suite: From Gene Data Mining to Disease Genome Sequence Analyses. Curr. Protoc. Bioinform. 2016, 54, 1.30.1–1.30.33. [Google Scholar] [CrossRef]
- Fujiwara, Y.; Hizukuri, Y.; Yamashiro, K.; Makita, N.; Ohnishi, K.; Takeya, M.; Komohara, Y.; Hayashi, Y. Guanylate-binding protein 5 is a marker of interferon-γ-induced classically activated macrophages. Clin. Transl. Immunol. 2016, 5, e111. [Google Scholar] [CrossRef] [PubMed]
- Chen, J.; Li, Y.; Lai, F.; Wang, Y.; Sutter, K.; Dittmer, U.; Ye, J.; Zai, W.; Liu, M.; Shen, F.; et al. Functional Comparison of Interferon-α Subtypes Reveals Potent Hepatitis B Virus Suppression by a Concerted Action of Interferon-α and Interferon-γ Signaling. Hepatology 2021, 73, 486–502. [Google Scholar] [CrossRef]
- Sweeney, T.E.; Braviak, L.; Tato, C.M.; Khatri, P. Genome-wide expression for diagnosis of pulmonary tuberculosis: A multicohort analysis. Lancet Respir. Med. 2016, 4, 213–224. [Google Scholar] [CrossRef] [PubMed]
- Yamakita, I.; Mimae, T.; Tsutani, Y.; Miyata, Y.; Ito, A.; Okada, M. Guanylate binding protein 1 (GBP-1) promotes cell motility and invasiveness of lung adenocarcinoma. Biochem. Biophys. Res. Commun. 2019, 518, 266–272. [Google Scholar] [CrossRef] [PubMed]
- Cheng, L.; Gou, L.; Wei, T.; Zhang, J. GBP1 promotes erlotinib resistance via PGK1activated EMT signaling in nonsmall cell lung cancer. Int. J. Oncol. 2020, 57, 858–870. [Google Scholar] [CrossRef] [PubMed]
- Ma, L.; Cao, J.; Liu, L.; Du, Q.; Li, Z.; Zou, D.; Bajic, V.B.; Zhang, Z. LncBook: A curated knowledgebase of human long non-coding RNAs. Nucleic Acids Res. 2019, 47, D128–D134. [Google Scholar] [CrossRef] [PubMed]
- Li, Z.; Liu, L.; Jiang, S.; Li, Q.; Feng, C.; Du, Q.; Zou, D.; Xiao, J.; Zhang, Z.; Ma, L. LncExpDB: An expression database of human long non-coding RNAs. Nucleic Acids Res. 2021, 49, D962–D968. [Google Scholar] [CrossRef]
- Zhao, J.; Guo, C.; Ma, Z.; Liu, H.; Yang, C.; Li, S. Identification of a novel gene expression signature associated with overall survival in patients with lung adenocarcinoma: A comprehensive analysis based on TCGA and GEO databases. Lung Cancer 2020, 149, 90–96. [Google Scholar] [CrossRef]
- Kent, W.J.; Sugnet, C.W.; Furey, T.S.; Roskin, K.M.; Pringle, T.H.; Zahler, A.M.; Haussler, D. The human genome browser at UCSC. Genome Res. 2002, 12, 996–1006. [Google Scholar] [CrossRef]
- Li, Q.; Wang, R.; Yang, Z.; Li, W.; Yang, J.; Wang, Z.; Bai, H.; Cui, Y.; Tian, Y.; Wu, Z.; et al. Molecular profiling of human non-small cell lung cancer by single-cell RNA-seq. Genome Med. 2022, 14, 87. [Google Scholar] [CrossRef]
- Chandra, V.; Ibrahim, H.; Halliez, C.; Prasad, R.B.; Vecchio, F.; Dwivedi, O.P.; Kvist, J.; Balboa, D.; Saarimäki-Vire, J.; Montaser, H.; et al. The type 1 diabetes gene TYK2 regulates β-cell development and its responses to interferon-α. Nat. Commun. 2022, 13, 6363. [Google Scholar] [CrossRef] [PubMed]
- Xu, D.; Shao, J.; Song, H.; Wang, J. The YTH Domain Family of N6-Methyladenosine “Readers” in the Diagnosis and Prognosis of Colonic Adenocarcinoma. BioMed Res. Int. 2020, 2020, 9502560. [Google Scholar] [CrossRef] [PubMed]
- Lv, X.; Li, X.; Chen, S.; Zhang, G.; Li, K.; Wang, Y.; Duan, M.; Zhou, F.; Liu, H. Transcriptional Dysregulations of Seven Non-Differentially Expressed Genes as Biomarkers of Metastatic Colon Cancer. Genes 2023, 14, 1138. [Google Scholar] [CrossRef] [PubMed]
- Liu, T.; Li, C.; Jin, L.; Li, C.; Wang, L. The Prognostic Value of m6A RNA Methylation Regulators in Colon Adenocarcinoma. Med. Sci. Monit. 2019, 25, 9435–9445. [Google Scholar] [CrossRef]
- Tanabe, A.; Tanikawa, K.; Tsunetomi, M.; Takai, K.; Ikeda, H.; Konno, J.; Torigoe, T.; Maeda, H.; Kutomi, G.; Okita, K.; et al. RNA helicase YTHDC2 promotes cancer metastasis via the enhancement of the efficiency by which HIF-1α mRNA is translated. Cancer Lett. 2016, 376, 34–42. [Google Scholar] [CrossRef]
- Yoshimura, K.; Suzuki, Y.; Inoue, Y.; Tsuchiya, K.; Karayama, M.; Iwashita, Y.; Kahyo, T.; Kawase, A.; Tanahashi, M.; Ogawa, H.; et al. CD200 and CD200R1 are differentially expressed and have differential prognostic roles in non-small cell lung cancer. Oncoimmunology 2020, 9, 1746554. [Google Scholar] [CrossRef]