
1. Introduction
Autism spectrum disorder (ASD) is a neurodevelopmental disorder characterized by impairments in social communication and interaction, with restricted repetitive stereotyped behaviors [1]. According to data from the United States Department of Education, the risk of developing ASD has increased by 10% to 17% annually [2]. In the United States, 1 in 36 children are diagnosed with ASD, and the prevalence is 3.8 times higher in boys than in girls [3]; the disorder places a heavy financial and emotional burden on families and society [4,5]. ASD is usually diagnosed at the age of 4 years, and magnetic resonance imaging (MRI) can aid early detection of abnormal changes in the brain [6], including increased brain volume, impaired integrity of white-matter fiber tracts, and abnormalities in the connectivity of the brain’s structural and functional networks, tissue perfusion, and neuronal metabolism [7,8,9]. With early diagnosis of ASD, scientific and effective interventions may help remodel the neural connectivity of the brain and improve the quality of life in children with ASD [10]. Currently, widely used MRI techniques include structural MRI (sMRI), diffusion tensor imaging (DTI), functional MRI (fMRI), three-dimensional arterial spin labeling (3D-ASL), and proton magnetic resonance spectroscopy (1H-MRS). This review aimed to explore potential imaging biomarkers to assist in early clinical diagnoses and precise interventions by analyzing the role of multimodal MRI in ASD from the existing literature (Figure 1).
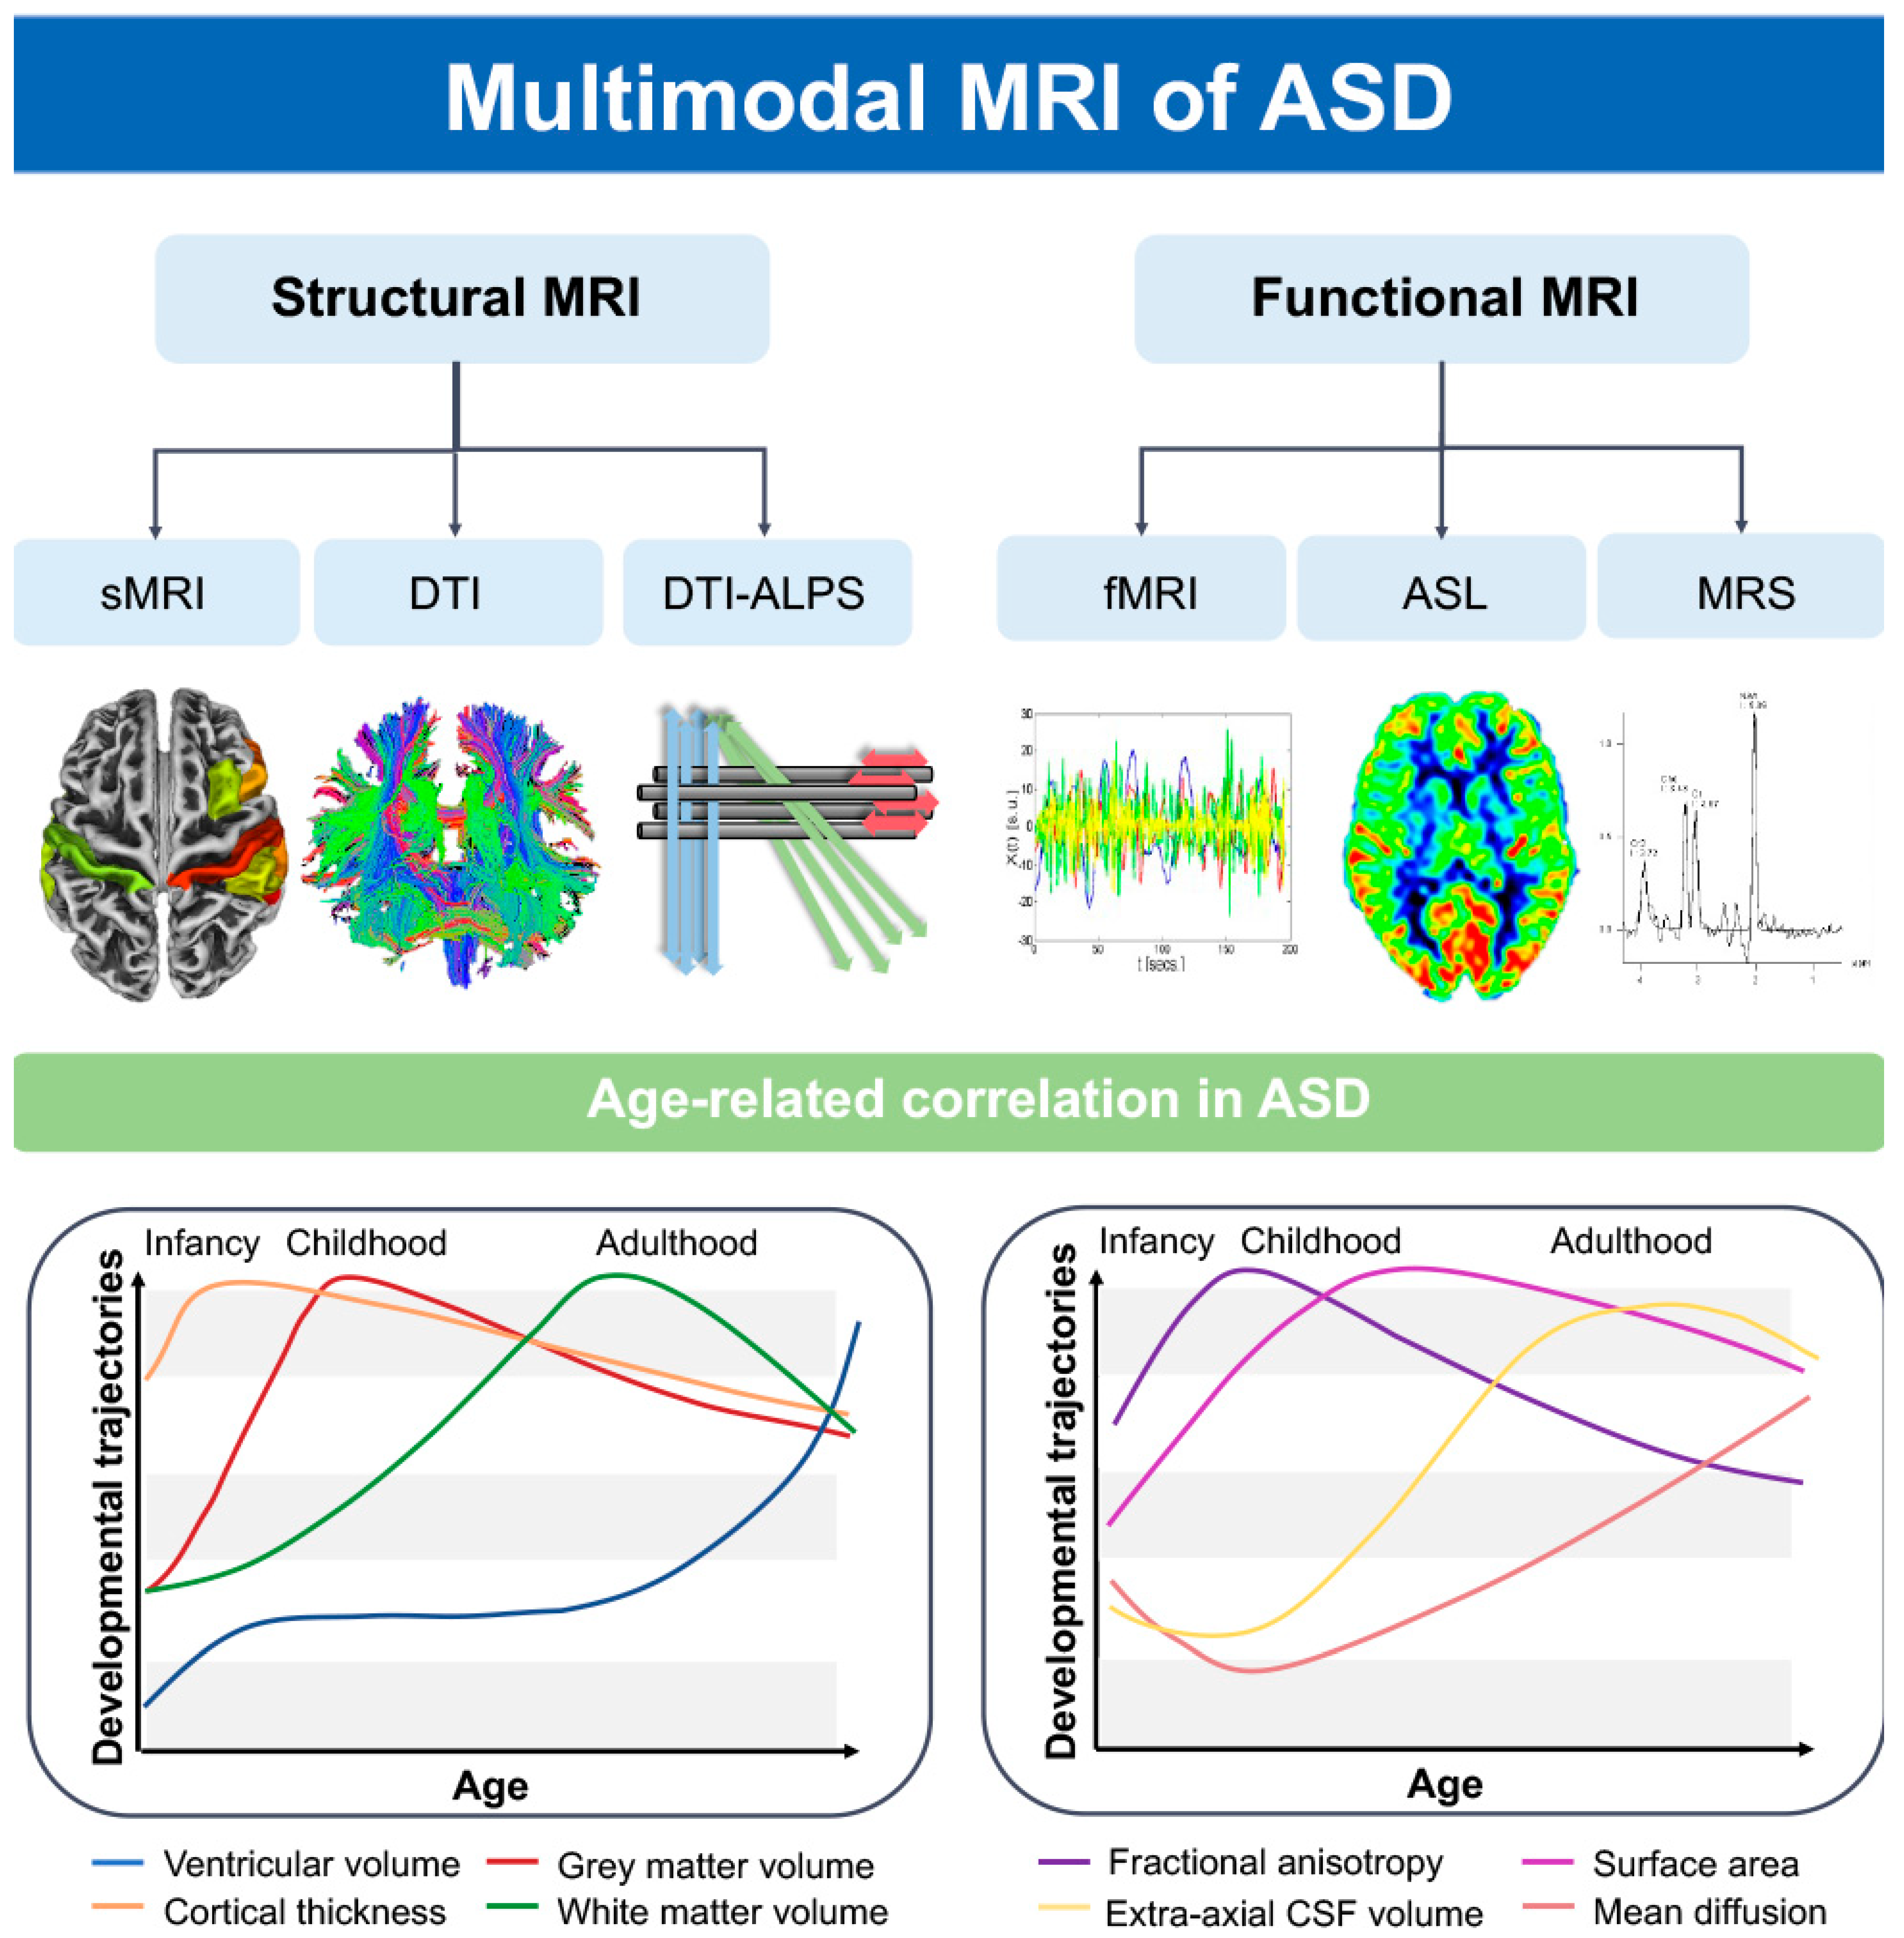
Figure 1. ASD patients’ brains exhibit distinct growth and developmental trajectories for various characteristics as age progresses [11,12]. Using structural magnetic resonance imaging (MRI), diffusion tensor imaging (DTI), functional MRI (fMRI), three-dimensional arterial spin labeling (3D-ASL), and proton magnetic resonance spectroscopy (1H-MRS), we can identify abnormal alterations in ASD patients’ brain morphology, structural-functional network, perfusion, neuronal metabolism, and the glymphatic system. FA, fractional anisotropy; MD, mean diffusion; EA-CSF, extra-axial cerebrospinal fluid; CT, cortical thickness.
2. Materials and Methods
A literature search of relevant databases (PubMed and Web of Science) was conducted to identify articles published between January 2010 and May 2023, using the following keyword strategy: “autism spectrum disorder” AND (“structural MRI” OR “diffusion tensor imaging” OR “functional MRI” OR “arterial spin labeling” OR “1H-MRS”) AND “diagnosis” AND “children”. Data were included from children (1) who had been diagnosed with ASD and (2) whose brain MRI had been performed. The exclusion criteria were as follows: (1) review articles, letters, comments, and case reports; (2) age > 6 years; (3) no relevant data; (4) studies using animal models; (5) genetic research (Figure 2).
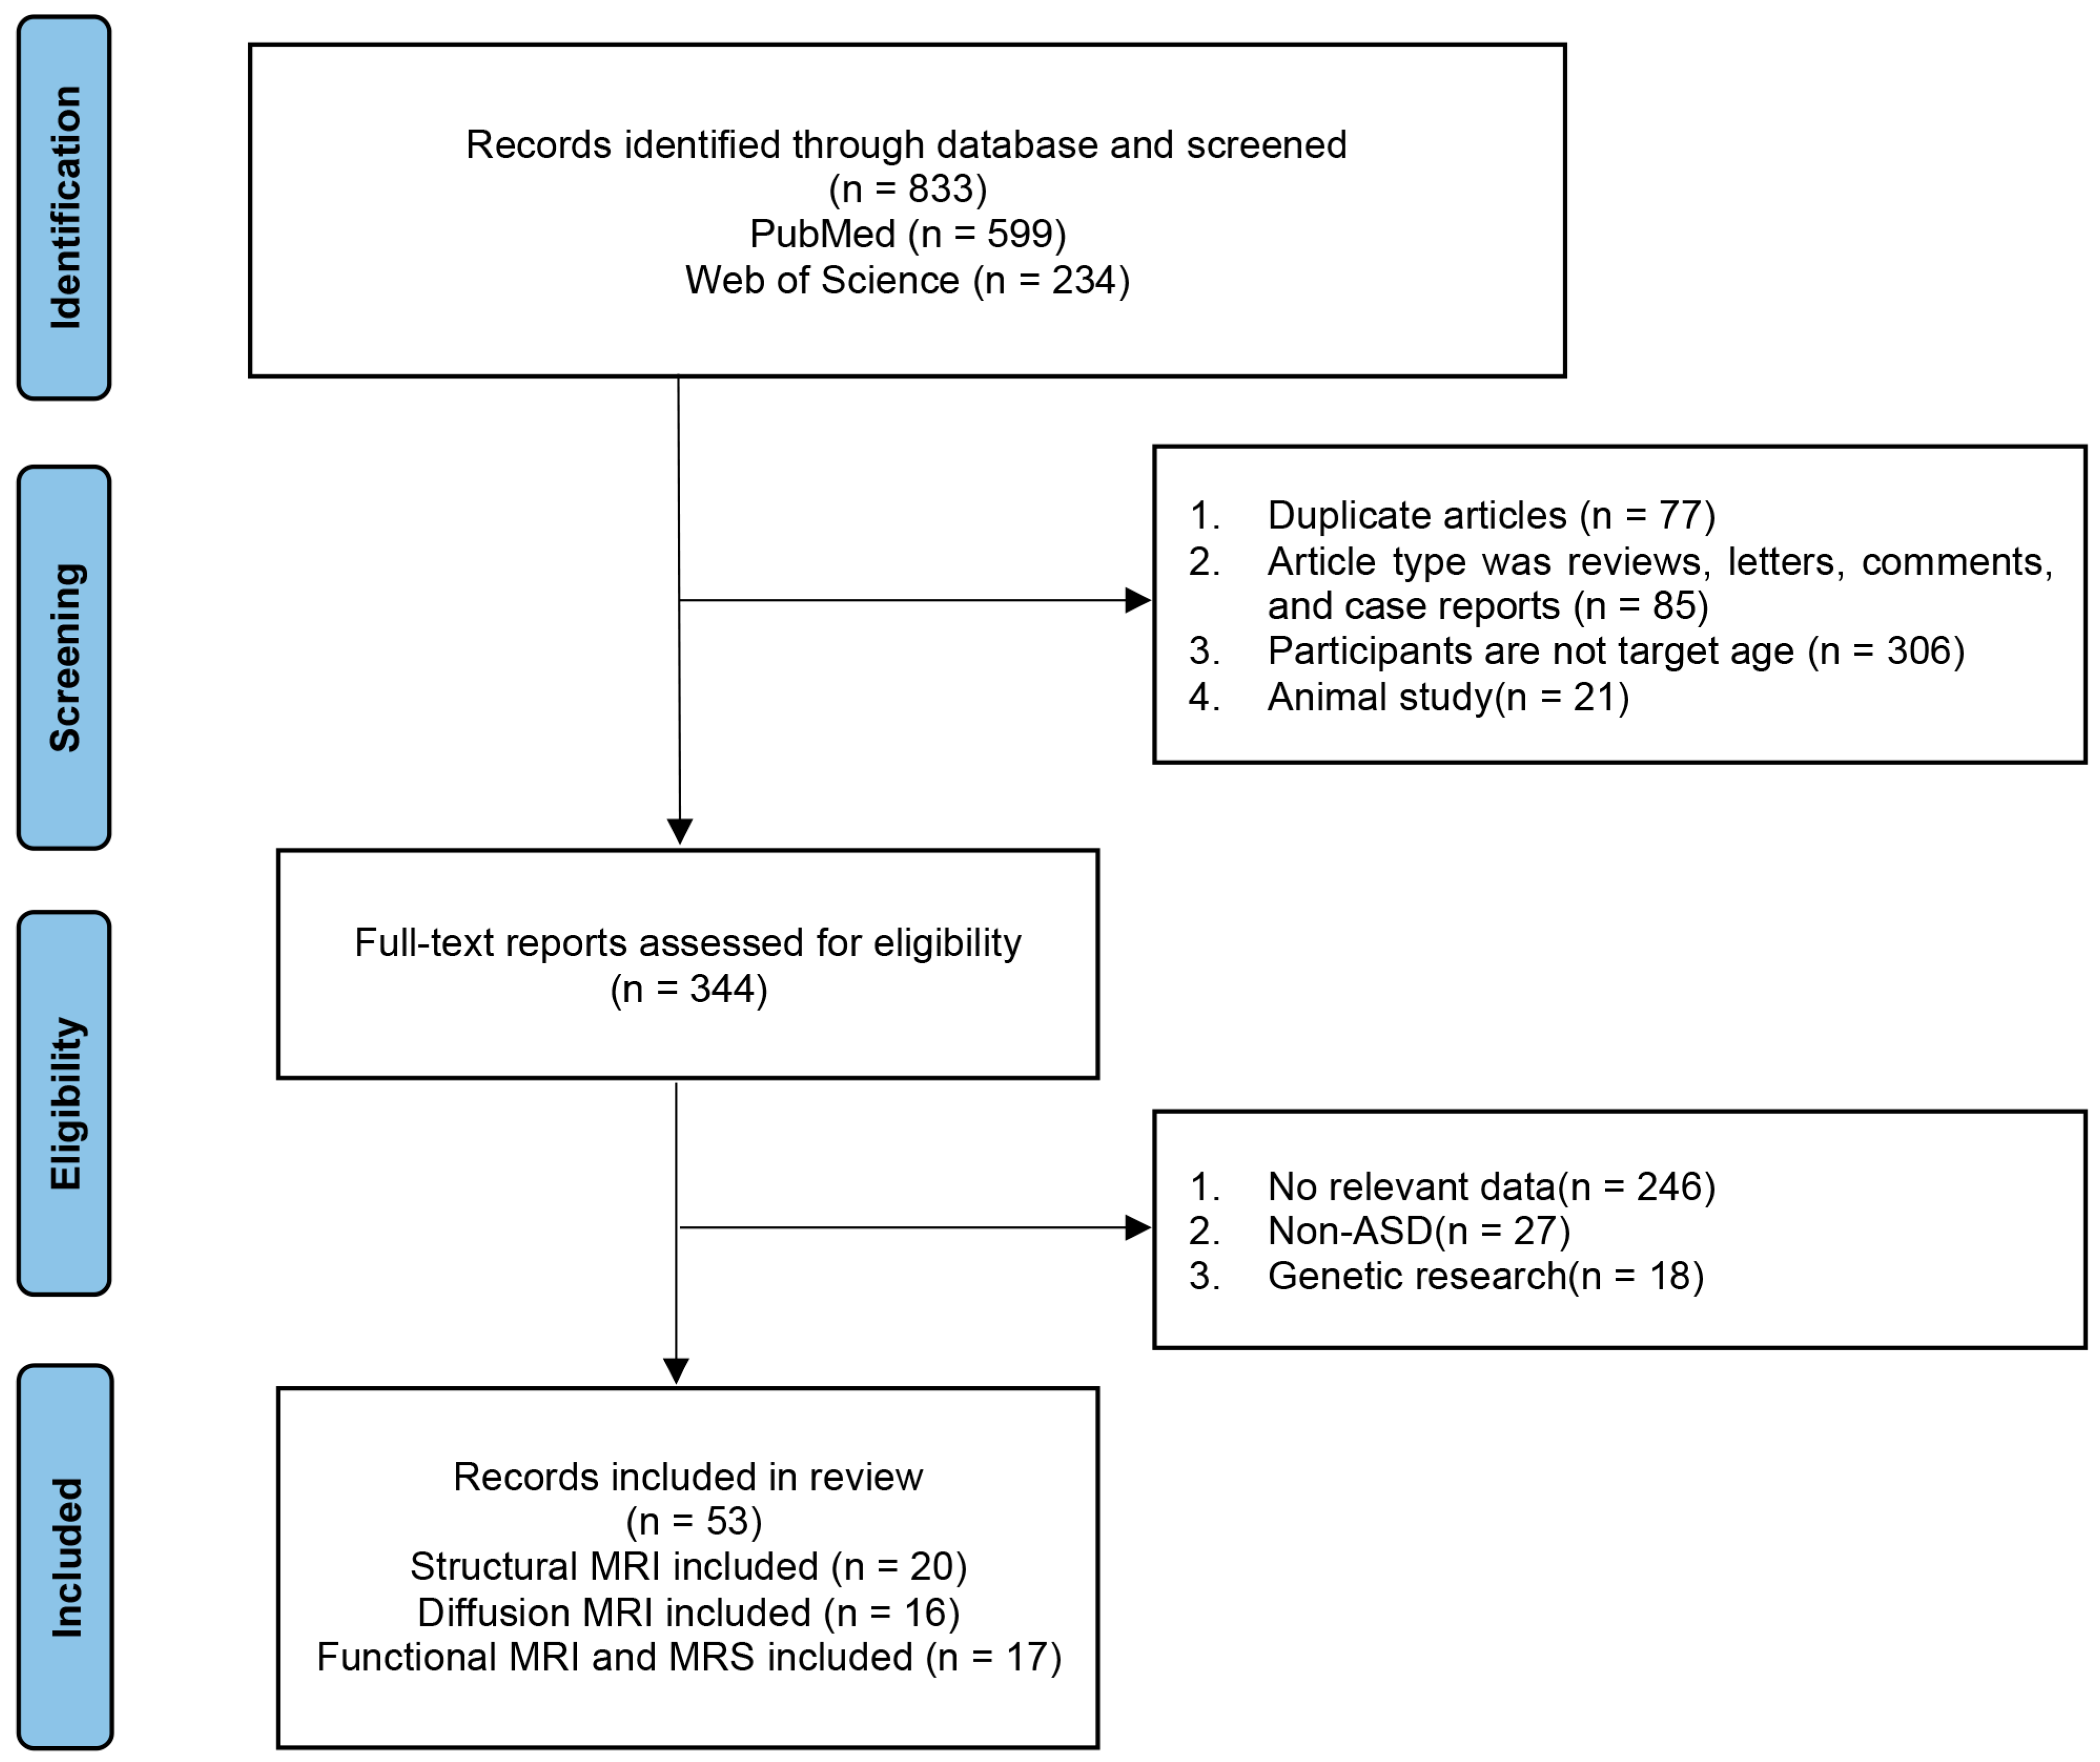
Figure 2. Flow chart of search results. ASD, autism spectrum disorder; MRI, magnetic resonance imaging; MRS, magnetic resonance spectroscopy.
3. Research Progress of Structural MRI in ASD
In sMRI, changes in brain volume in children with ASD are shown using voxel-based morphometry. Changes in the surface area and thickness of the cerebral cortex can be studied using surface-based morphometry. The brain volume of children with ASD begins to increase at the age of 12–24 months, rapidly increases at 2.5 years, and increases by approximately 10% compared with the brain of typically developing (TD) children at the age of 2–4 years; the brain volume then increases slowly during late childhood and adolescence [6,13,14,15]. Excessive early brain growth may be associated with an increased number of neurons, which in turn results in an excess of axons, dendrites, synapses, and myelin, leading to increase in both gray- and white-matter volumes in the brain [16]. In addition, the symmetric amplification of germinal cells around the ventricles in individuals with ASD may lead to an increase in minicolumns, which could contribute to the expansion of the cortical surface area. This increased surface area is primarily located in the middle occipital gyrus, cuneus, and lingual gyrus areas, further promoting early brain overgrowth [15,17,18]. Compared with TD children, the volumes of the bilateral superior frontal gyrus, left precuneus, left inferior occipital gyrus, right angular gyrus, bilateral superior temporal gyrus, and left inferior parietal lobule of the brain are increased in children with ASD [6,19,20,21], whereas the right inferior temporal gyrus decreases in volume, thereby reflecting the atypical nature of the brain structure in children with ASD [22]. As the angular and superior frontal gyri are located in the cognitively relevant default mode network (DMN), their volume changes are closely associated with social and cognitive deficits [15]. Children with ASD have increased hippocampal volume compared with that of TD children [23,24,25]. Specifically, the left hippocampal white-matter volume increases [26] while bilateral gray-matter volume decreases [27] or increases compared with TD children [28]. The increase in hippocampal volume may be associated with an increase in pyramidal neurons during the birth process [29]. Due to the involvement of the hippocampus in the core functions of the “social brain,” changes in its volume can lead to language and cognitive impairments [26,27]. Previous studies have shown that histopathological changes in the cerebellum, such as the reduction of granule cells, hypertrophy, and atrophy of cerebellar nuclei can be observed in the postmortem brains of individuals with ASD [30]. Increased cerebellar volume at 4–6 months of age in children with ASD can predict the emergence of restricted and repetitive behaviors in early childhood [31]. Increased cerebellar volume during infancy and childhood in individuals with ASD may be related to early brain overgrowth [30], while the decreased cerebellar volume in adolescents and adults with ASD is positively correlated with the severity of motor restrictions [32,33]. Additionally, asymmetrical changes in brain region volumes exist in individuals with ASD, with a decrease in volume in the left motor system and an increase in volume in the right motor system, leading to motor abnormalities [34]. Rightward asymmetry is observed in the planum temporale and posterior superior temporal gyrus, affecting the language function area known as Wernicke’s area located between them, which is associated with language impairments in individuals with ASD [35].
In addition to changes in volume, children with ASD also exhibit abnormalities in cortical thickness. Children with ASD have significant cortical thickening in early childhood, accelerated thinning in late childhood and adolescence, and gradual cortical thinning with age in adulthood. These cortical changes in the inferior frontal, inferior temporal, and posterior cingulate gyri are the most pronounced. These changes are associated with social cognitive deficits, verbal communication deficits, and stereotypical movements [36,37,38,39,40,41,42,43]. Normally, brain regions maintain structural and functional laterality. Cortical thickness asymmetry of the medial frontal, orbitofrontal, inferior temporal, and cingulate gyri is reduced in children with ASD, reflecting disruption of lateralized neurodevelopment [44,45]. Orbitofrontal cortical abnormalities are strongly associated with self-regulation and social–emotional–behavioral deficits in children with ASD [46]. As the cerebral cortex expands within the limited space in the skull, it gradually increases the number of cortical folds [47]. In children with ASD, the gyrification index, which reflects the degree of cortical folding, increases atypically in childhood and then decreases in adolescence and adulthood, primarily in the frontal and parietal regions [48,49,50]. In children with ASD, the cortical gyrification index is significantly higher in the bilateral temporal lobes, left isthmus cingulate, and left frontal lobe and lower in the right precuneus compared with that in TD children, thereby reflecting the presence of atypical rotational patterns in children with ASD [49,51,52,53]. Gao et al. [54] used sMRI combined with convolutional neural networks and individual structural covariance networks for the early assessment of ASD with an accuracy of 71.8%, sensitivity of 81.25%, and specificity of 68.75%. They also suggested that abnormalities in the prefrontal cortex and cerebellum may be early biomarkers for the diagnosis of ASD. In addition, sMRI not only reveals the morphological differences in brain structures at different ages, but also further clarifies the pathophysiological alterations of the disease by correlating them with the core symptoms of ASD. Thus, sMRI contributes to the early diagnosis of ASD. A summary of the literature on structural MRI-based morphological changes in the brains of individuals with ASD is provided in .
4. Studying Brain Network Changes in Children with ASD Using DTI
Diffusion tensor imaging is a non-invasive technique for assessing the orientation and connectivity of cerebral white-matter fiber bundles, thereby allowing for qualitative and quantitative analyses of water-molecule diffusion characteristics within three-dimensional spaces [51]. Commonly used parameters include fractional anisotropy (FA) and mean diffusion (MD), which reflect microstructural changes in the white matter [55]. FA increases in children with ASD before the age of 4 years, which may be associated with excess prenatal neurons, leading to frontal axonal overconnectivity [56]. This excessive axonal growth leads to signal delays and metabolic inefficiencies in connecting different regions of the brain, thus affecting myelin development [56]. After the age of 4 years, the rate of myelination development slows down, resulting in a decrease in the integrity of white-matter fiber bundles throughout the brain and a gradual decline in FA [57,58]. Compared with TD children, children with ASD show increased FA during early childhood, primarily observed in the corpus callosum, inferior longitudinal fasciculus, inferior fronto-occipital fasciculus, posterior cingulate cortex, and limbic lobe. A higher FA in the corpus callosum is associated with impaired social and communicative functions, and that in the inferior longitudinal fasciculus and inferior fronto-occipital fasciculus is associated with difficulty in recognizing emotions and facial expressions [11,59]. During the childhood phase in ASD individuals, there is a decline in FA, primarily observed in the sagittal stratum, corpus callosum, superior cerebellar peduncle, superior longitudinal fasciculus, cingulum, and uncinate fasciculus, which are associated with motor functions, language, and social impairments [57,58,60,61,62,63,64,65]. However, Weinstein et al. [66] found increased FA values in the corpus callosum and superior longitudinal fasciculus in children with ASD aged 1.5–6 years old. This inconsistency in research findings may be attributable to variations in the age range of the study samples [67]. In comparison with TD children, children with ASD show decreased MD values in the left corpus callosum, posterior cingulate cortex, limbic lobe, and insular cortex during early childhood, which are associated with cognitive impairments [11]. In ASD individuals, during late childhood, adolescence, and adulthood, the increased MD is mainly observed in the left parahippocampal gyrus, left sagittal gyrus, left superior temporal gyrus, and left arcuate fasciculus. The atypical lateralization reflects abnormal connectivity in the left hemisphere white matter and is associated with language and praxis impairments [8,68,69,70,71,72].
Furthermore, graph theory analysis based on DTI can reflect the whole-brain connectivity characteristics of individuals with ASD. Network properties include the clustering coefficient, local efficiency, shortest path length, global efficiency, and small-worldness coefficient. Based on DTI brain network connectivity, the node efficiency of the left pallidum, right caudate nucleus, left precuneus, thalamus, and bilateral superior parietal cortex increased in children with ASD aged 2–6 years compared with TD children [73,74]. Increased node efficiency reflects the presence of hyperconnectivity in the brain structures of preschool-going children with ASD, which may be related to early brain overgrowth. The nodal efficiency of the precuneus is correlated with the severity of ASD [73]. The increased nodal efficiency primarily occurs in the left hemisphere of the brain, specifically in regions associated with language and social communication functions. Therefore, the enhanced network efficiency in the left hemisphere may contribute to language and social impairments in children with ASD [73]. However, reduced nodal efficiency in adolescents and adults with ASD compared with TD individuals suggests that impaired integrity of white-matter fiber tracts may disrupt the topological properties of nodal connectivity fibers. The regions with reduced nodal efficiency are mainly located in the left inferior frontal gyrus, left precentral gyrus, right cingulate gyrus, right precuneus, and right amygdala, which are associated with impaired language and social communication [75,76]. Qian et al. [76] conducted a longitudinal study on ASD children aged 2–5 years and found that there was an increase in four additional hubs at the age of 4–5 years compared with 2–3 years. These additional hubs include the left anterior cingulate and paracingulate, right dorsolateral superior frontal, right middle frontal, and angular gyri. This suggests that the brain in ASD has a remarkable flexibility to rewrite itself [77]. Additionally, children with ASD show a decrease in small-world attributes, indicating a disruption in the balance of information transmission within the white-matter structural network. Shortened path lengths, increased global efficiency, and clustering coefficients of the basal ganglia, limbic, and paralimbic systems in children with ASD indicate brain hyperconnectivity, which in turn is associated with repetitive stereotyped behaviors and learning and memory disorders [74]. However, Li et al. [78] found that monozygotic twins with ASD had reduced global efficiency and increased characteristic path lengths in brain networks, which were associated with core symptoms, such as repetitive behaviors. The differences in findings reflect atypical brain development in children with ASD, which is associated with age, different subtypes, brain damage, and excessive remodeling and requires further research.
In addition, edge density (ED) can further elucidate the brain connectome by examining the potential fiber bundles between cortical nodes. Changes in connectivity around the ventricles are associated with ASD, where ED increases during early childhood. However, during adolescence, there is a widespread reduction in ED within white-matter fiber bundles except for the internal capsule. In adults with ASD, the regions exhibiting decreased ED are mainly located in the posterior commissural and paraventricular white-matter tracts [8]. Furthermore, a machine-learning method that combines the DTI brain network and T1-weighted imaging to assess children with ASD aged 2–6 years has an accuracy, sensitivity, and specificity of 88.8%, 93%, and 83.8%, respectively [79]. Therefore, studies using DTI in children with ASD can not only reveal abnormal developmental trajectories and network connectivity changes in the brain at an early stage, but, upon combination with machine learning, are more helpful for the early diagnosis of children with ASD [80]. summarizes the literature on brain network alterations using DTI in patients with ASD.
5. Functional MRI–Based Functional Brain Network Alterations in ASD
Resting-state fMRI (rs-fMRI) reflects neural activity and functional changes in the functional areas of the brain by studying the temporal correlation of blood oxygen-level-dependent signals in different brain regions [81]. Based on rs-fMRI, abnormal functional connectivity (FC) was found in the brains of children with ASD, most notably located in the DMN, salience network (SN), central executive control network (ECN), ventral attention networks (VAN), and dorsal attention networks (DAN) [82,83]. The DMN, with the rostral anterior cingulate cortex and medial prefrontal cortex as key brain regions, is primarily involved in intrinsic mental activities, such as recalling the past, envisioning the future, and simulating non-occurring social interactions [84]. The SN, with the anterior cingulate and ventrolateral prefrontal cortices as key brain regions, primarily differentiates between internal and external stimuli to guide behavior [85], and damage to the SN may lead to impairments in social–emotional functioning [86]. The ECN, with the dorsolateral prefrontal and parietal cortices as core regions, participates in processes of attention, decision making, working memory, and response selection [87]. The DAN, composed of the dorsolateral prefrontal cortex, superior temporal gyrus complex, and other areas, is primarily involved in controlling attention processes [88]. In contrast to TD, functional network hyperconnectivity in children with ASD, owing to early brain overgrowth and increased neural density, is located mainly in the medial prefrontal, cingulate, and temporal poles of the DMN, and is associated with socio-emotional disorders [89,90]. Recent studies suggest that early and persistent abnormal connections between the temporal lobe and the cuneus and precuneus lobes during early childhood in patients with ASD may be biomarkers of early language and social dysfunction in children with ASD [91]. There is also hyperconnectivity between brain networks in children with ASD, mainly between the DMN and DAN, DMN and control networks, and visual and sensorimotor networks [92,93,94]. With age, adolescents and adults with ASD mainly exhibit the coexistence of hypo- and hyperconnectivity networks, reflecting uneven brain development. Hypoconnectivity is mainly existent in the sensorimotor brain regions, and hyperconnectivity in the prefrontal and parietal cortices [83,89,90,95,96,97,98,99,100,101,102]. In adolescents with ASD, DMN and right ECN hyperconnectivity, and SN and left ECN hypoconnectivity are associated with sensory deficits and impaired social communication [86,87,103]. In adults with ASD, hypoconnectivity between the DMN and VAN and between the SN and medial temporal lobe networks is strongly associated with impaired social functioning and reflects the severity of ASD [104,105,106,107]. Under normal circumstances, there is functional segregation between the primary somatosensory and auditory regions in children, which increases significantly with age. However, in children with ASD, there is hyperconnectivity between subcortical and cortical sensory regions that does not change with age. This reflects a delayed or arrested development of segregation in these areas, which is associated with socio-cognitive impairments [108]. In addition to the above-mentioned brain networks, researchers have found increased FC between the cerebellum and the posterior motor and somatosensory cortices, resulting in abnormal processing of sensory and motor functions [109].
In addition, Sha et al. [110] found reduced leftward lateralization in the fusiform, rostral middle frontal, and medial orbitofrontal cortices of children with ASD. There was also a decrease in rightward asymmetry of both degree centrality and global efficiency in the superior frontal cortex, indicative of node-level degree centrality asymmetries in children with ASD. These asymmetries are associated with executive function, working memory, and sensorimotor impairments. Floris et al. [111] found that compared with TD children, older children with ASD exhibited rightward lateralization in mean motor circuit connectivity, which may contribute to gross motor deficits and atypical gait. Previous studies have rarely explored ASD during infancy. Recent research suggests that key FC networks, such as the DMN and DAN, can be detected in infants at birth, which will aid in the early diagnosis of ASD [112]. Du et al. [113] combined network FC features in fMRI with gray-matter volume in sMRI for machine learning-based assessment of ASD, with an accuracy of 83.08%. Early diagnosis of ASD is based on fMRI deep learning, with an accuracy and sensitivity of 65.5% and 84%, respectively [2]. Combining fMRI with machine learning has further improved the diagnostic performance of ASD. summarizes the fMRI-based literature on functional brain network damage in patients with ASD.
6. ASL-Based Alterations in ASD Perfusion
Arterial spin labeling is a non-invasive MRI technique that utilizes magnetically labeled arterial blood water as an endogenous tracer. It quantifies changes in cerebral blood flow (CBF) within functional brain regions, thereby reflecting the association between cerebral perfusion and core symptoms. Reduced CBF in children with ASD may lead to abnormal neuronal development in the brain, and the number of hypoperfused brain regions is positively correlated with age in children with ASD [104]. This abnormal neurodevelopment leads to cognitive, language, and motor developmental impairments in children with ASD [114]. However, CBF values in the frontal lobe show a non-linear correlation with age. At the ages of 2 and 5 years, CBF in the frontal lobe of children with ASD is normal. Around the ages of 3–4 years, there is a decline in CBF. This may be associated with slower growth and development of the frontal lobe in children with ASD starting at age 3, followed by a gradual normalization of frontal lobe development around age 5. However, after the age of 6, CBF in the frontal lobe gradually decreases [114]. The decreased CBF in the left frontal lobe, bilateral parietal lobes, bilateral temporal lobes, and insula in children with ASD is associated with impaired communication and socio-cognitive deficits and decreased self-care skills [115,116,117]. Reduced CBF in the bilateral fusiform and right inferior temporal gyri in adolescents with ASD is associated with deficits in social cognition and facial recognition [123]. Tang et al. [114] found that decreased CBF in the frontal, temporal, hippocampal, and caudate nucleus regions in individuals with ASD aged 2–18 years could be effective in the differential diagnosis of ASD, with the highest area under the curve (AUC) of 0.84. In addition, increased CBF in adolescents and adults with ASD reflects hyperperfusion, which may be related to the increase in metabolic demands caused by the remodeling of neural axons or glial cells after injury, with increased CBF in the medial orbitofrontal cortex, bilateral inferior frontal gyrus, and right precentral gyrus associated with social communication deficits in children [124,125]. In normal conditions, the FC within the brain of healthy individuals is tightly coupled with CBF and energy supply. This close coupling allows functional regions to engage in more neural activity, particularly in areas of the association cortex where the neurovascular coupling is higher, promoting active involvement in higher cognitive functions and efficient execution of effective information processing. At the same time, these regions exhibit a high long-range and a high CBF/FC ratio, reflecting the high metabolism of long-distance connections in the brain. In contrast, the primary visual cortex, which has abundant short-range connections, exhibits a lower CBF/FC ratio. It is speculated that the low metabolism associated with short-range connections helps conserve energy in the brain [126]. However, children with ASD may exhibit neurovascular decoupling in which decreased CBF in the anterior cingulate cortex is accompanied by increased FC associated with social cognitive deficits [124]. Children with ASD exhibit abnormalities in the inhibitory/excitatory balance of local neuronal clusters in the frontal cortex. The lack of inhibition may impair the establishment of long-range FC pathways and disrupt the balance between network metabolism and axonal connectivity, leading to neurovascular decoupling [124].
Therefore, altered neurovascular coupling may serve as an emerging biomarker for early diagnosis of ASD in children. A summary of the ASL-based ASD perfusion research literature is presented in .
7. Proton Magnetic Resonance Spectroscopy–Based Biochemical Metabolite Alterations in ASD
Proton magnetic resonance spectroscopy is a non-invasive neuroimaging technique used to quantify the concentrations of biochemical metabolites in specific regions of the brain. It reveals the pathological basis of ASD by identifying abnormalities in molecular behaviors. The primary metabolites assessed include N-acetylaspartate-containing compounds (NAA), creatine-containing compounds (Cr), choline-containing compounds (Cho), glutamate + glutamine (Glx), myo-inositol (mI), and gamma-aminobutyric acid (GABA). NAA, predominantly located within neurons and axons, serves as a biomarker for neuronal density, heterogeneity, and vitality [127,128]. Compared with TD children, children with ASD show a decrease in NAA concentrations. This decline primarily occurs in the left amygdala [129], bilateral orbitofrontal cortex [118], thalamus [130], anterior cingulate cortex [119,131], temporal cortex, cerebellum [127], and parietal lobe [132]. These reductions reflect impaired, diminished, or immature neuronal function in ASD, which is associated with social deficits and memory impairments [129,132]. Cr refers to the combined signal of creatine and phosphocreatine and plays a crucial role in maintaining energy homeostasis in the central nervous system. Children with ASD exhibit a reduction in the NAA/Cr ratio in the prefrontal white-matter region and anterior cingulate cortex, suggesting alterations in axonal function and cognitive impairments [119,120,128,133]. GABA, the predominant inhibitory neurotransmitter in the cerebral cortex, plays a crucial role in maintaining the balance of neural circuits [127]. Compared with TD children, children with ASD show decreased GABA levels in the frontal cortex, parietal lobe, and somatosensory motor area, reflecting excessive excitability in the cerebral cortex [121,127,134]. The decrease in GABA concentrations in the somatosensory motor area is associated with abnormal processing of tactile information. The reduced GABA concentration in the frontal cortex may be due to deficits in GABAergic interneurons, leading to glial activation, migration defects, and impairments in communication and cognition [127]. Furthermore, studies have found a positive correlation between GABA levels and age in the left parietal lobe of children with ASD [121]. In adults with ASD, there is an increase in GABA concentration in the left dorsolateral prefrontal cortex. The changes in GABA concentration in the prefrontal cortex, from decreased levels in childhood to increased levels in adulthood, reflect the importance of age-related alterations in brain neurometabolism in individuals with ASD [12]. Additionally, in children with ASD, there is a decreased GABA/Cr ratio in the left motor, anterior cingulate cortex, and auditory cortices, which is negatively correlated with the severity of ASD symptoms [122,135]. Glutamate (Glu), as an excitatory neurotransmitter, plays a crucial role in synaptic induction, cell migration, synaptic elimination, and other functions that are essential in neurodevelopmental processes. Glutamine (Gln) participates in the regulation of glutamate recycling and brain ammonia metabolism [127]. Glu, Gln, and GABA interact through the glutamate/GABA-glutamine cycle to maintain cortical excitatory/inhibitory balance, which is crucial for synaptic maturation, refinement of neuronal circuits, and regulation of cognition, emotion, and behavior [132,136]. Glx represents the overall levels of Glu and Gln and their functions in the brain. Compared with TD children, children with ASD have increased Glu concentration in the cingulate gyrus and prefrontal cortex, possibly due to decreased levels of glutamic acid decarboxylase, the enzyme that converts Glu to GABA in the brain [127,131]. Previous studies have suggested that an imbalance between excitation and inhibition in individuals with ASD forms the neurobiological basis of cognitive impairments [137,138]. ASD patients show alterations in GABA, Glx, Glu/Cr, and GABA+/Glu concentrations within the frontal and cingulate cortices at different developmental stages, reflecting an imbalance between neurotransmitter excitation and inhibition [12,139,140]. Cho, composed of phosphatidylcholine metabolites, is used to measure membrane turnover rate. mI, a key component of the second messenger system, serves as a specific marker for astrocytes [127]. The significant reduction of Cho and mI in the anterior cingulate cortex and frontal lobe of children with ASD indicates impaired neuronal integrity in these regions, which is associated with social impairments [119]. Hence, by quantifying abnormal changes in brain metabolites at different stages, 1H-MRS can assist in diagnosing ASD. In the future, the combination of 1H-MRS and multimodal MRI will help further delineate the diverse phenotypes of ASD.
8. Glymphatic System Changes in ASD
Evaluating the coupling relationship between neurovascular and cerebrospinal fluid (CSF) may reveal the complex pathophysiological mechanisms of the brain in ASD and may provide new insights into the early diagnosis of ASD. The glymphatic system is a unique network in the central nervous system of the brain, which allows the dynamic exchange of CSF and interstitial fluid through pathways such as the paravascular spaces (PVS). These play an important role in normal homeostasis and interstitial solute clearance. Water in the CSF can transport soluble Aβ and tau proteins and the energy metabolite lactate from the brain tissue through the induction of polarized astrocyte-specific aquaporin-4 into the interstitium [141]. Elevation in Aβ protein levels was observed in the neurons of postmortem brain tissue, blood, and peripheral CSF of individuals with ASD, which may have been associated with an impaired glymphatic system [142]. It was found that 44% of children with ASD had an enlarged PVS [143]. Recent studies have indicated that the function of the glymphatic system in the brains of individuals with ASD can be assessed using DTI along the perivascular space (DTI-ALPS). DTI-ALPS uses the diffusion tensor method to measure the diffusivity rate of water molecules and assess the movement of water molecules in the direction of the PVS. Studies have shown that reduced DTI-ALPS reflects impaired glymphatic function in children with ASD and is positively correlated with age [144]. In addition, children with ASD have increased extra-axial CSF (EA-CSF) at the age of 6–24 months and 2–4 years, which is associated with deficits in gross motor skills and non-verbal abilities [142,145,146]. Increased EA-CSF may be due to impaired early brain venous drainage or immature development of arachnoid granulations in young children with ASD, leading to reduced absorption [147]. Subsequently, the increased EA-CSF gradually normalizes after 4 years of age in children with ASD, which may be related to the gradual normalization of early increase in brain volume in later childhood [142,147]. Shen et al. [145] found that increased EA-CSF at 6 months of age could predict ASD at 24 months of age with 69% accuracy. Moreover, Diem et al. [148] suggested that arteriolar dilatation caused by neurovascular coupling could play a key role in the removal of cerebral waste products. Further studies are needed to determine whether neurovascular uncoupling involves the glymphatic system in children with ASD (Figure 3).
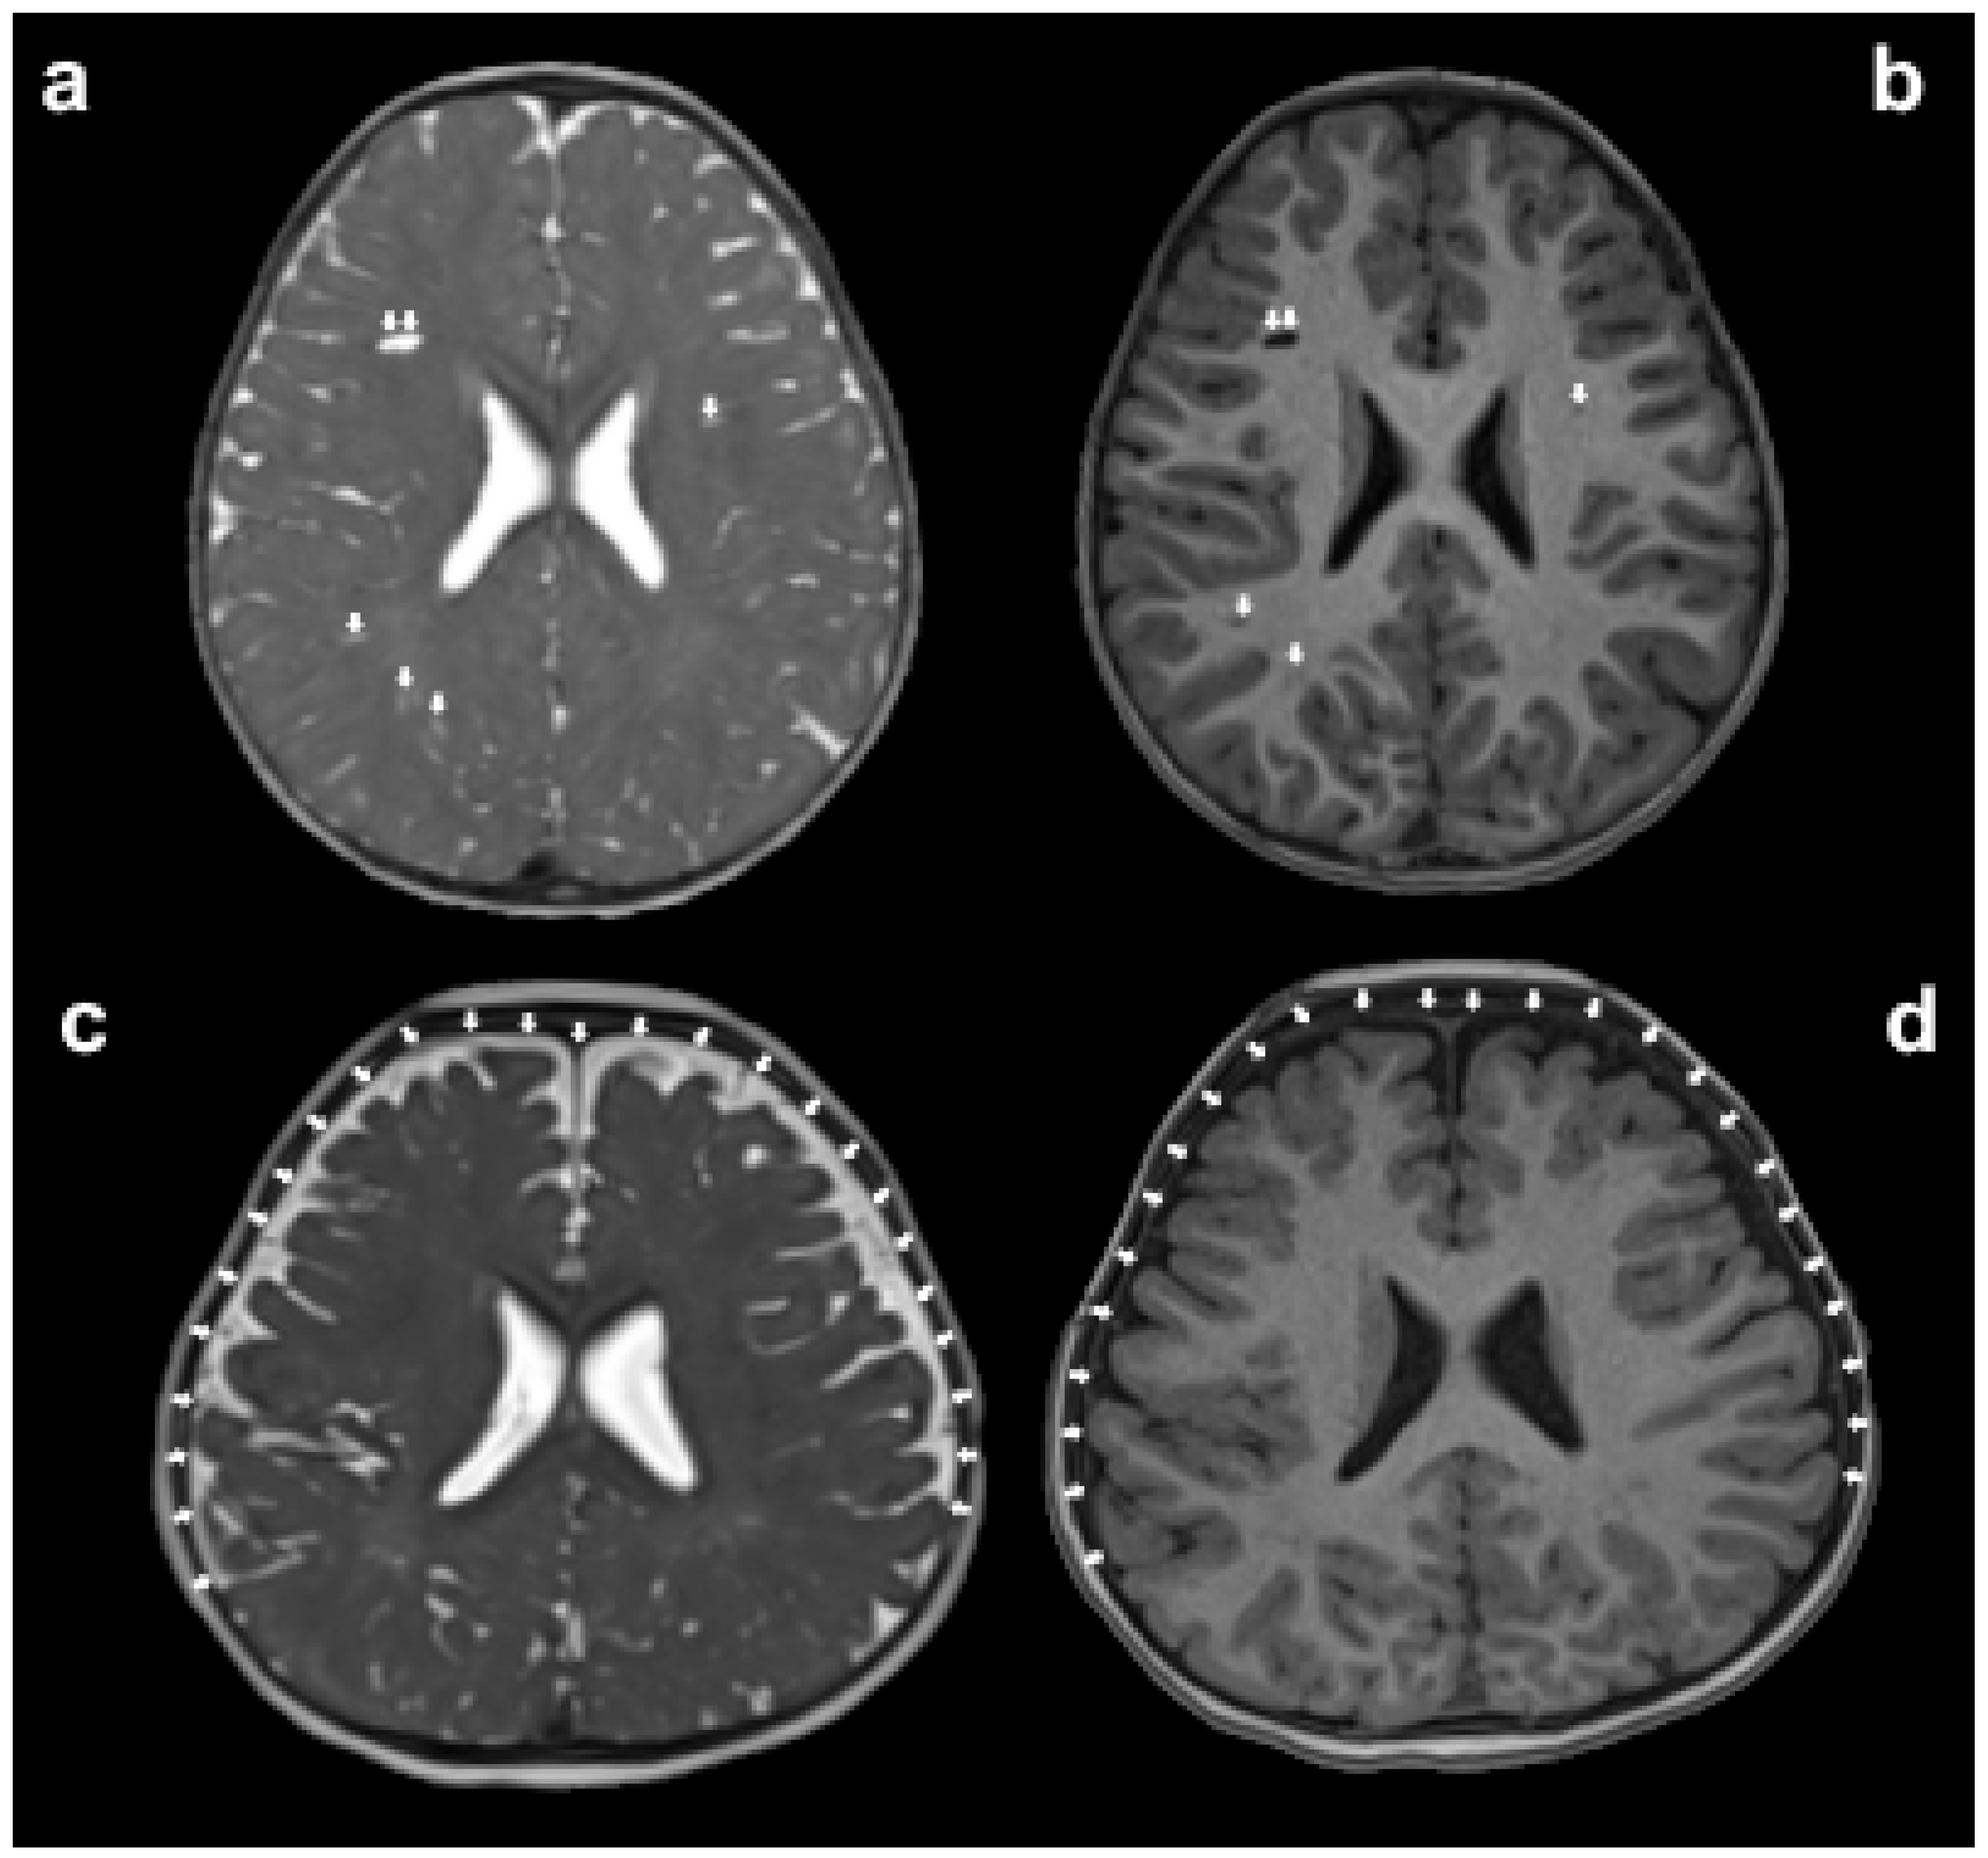
Figure 3. The assessment of glymphatic system disorders can be indirectly made by observing whether there is an enlargement in the volume of paravascular spaces (PVS) and extra-axial cerebrospinal fluid (EA-CSF) on magnetic resonance imaging (MRI). The white arrows in panels (a,b) indicate the enlarged PVS, while the white arrows in panels (c,d) point out the increased volume of EA-CSF.
9. Conclusions
In summary, ASD is not only characterized by abnormal changes in brain morphology, structure–function connectivity, cerebral perfusion, and neuronal metabolism, but also by some degree of impairment in the function of the glymphatic system. Differences in age, subtype, brain damage, and remodeling in children with ASD, could lead to heterogeneity in research results.
10. Future Directions
Exploring the mechanism of brain damage in children with ASD and determining imaging biomarkers based on multimodal MRI remains the focus of future research, with an aim to provide an objective basis for the early identification of ASD and assist the clinic in formulation of individualized intervention plans. Multimodal MRI is expected to further assist in the early and accurate clinical diagnosis of ASD through deep learning combined with genomics and artificial intelligence.
References
- Rafiee, F.; Rezvani Habibabadi, R.; Motaghi, M.; Yousem, D.M.; Yousem, I.J. Brain MRI in Autism Spectrum Disorder: Narrative Review and Recent Advances. J. Magn. Reson. Imaging 2022, 55, 1613–1624. [Google Scholar] [CrossRef]
- Akhavan Aghdam, M.; Sharifi, A.; Pedram, M.M. Combination of rs-fMRI and sMRI Data to Discriminate Autism Spectrum Disorders in Young Children Using Deep Belief Network. J. Digit. Imaging 2018, 31, 895–903. [Google Scholar] [CrossRef]
- Maenner, M.J.; Warren, Z.; Williams, A.R.; Amoakohene, E.; Bakian, A.V.; Bilder, D.A.; Durkin, M.S.; Fitzgerald, R.T.; Furnier, S.M.; Hughes, M.M.; et al. Prevalence and Characteristics of Autism Spectrum Disorder Among Children Aged 8—Autism and Developmental Disabilities Monitoring Network, 11 Sites, United States, 2020. MMWR Surv. Summ. 2023, 72, 1–14. [Google Scholar] [CrossRef] [PubMed]
- Rogge, N.; Janssen, J. The Economic Costs of Autism Spectrum Disorder: A Literature Review. J. Autism Dev. Disord. 2019, 49, 2873–2900. [Google Scholar] [CrossRef]
- Leigh, J.P.; Du, J. Brief Report: Forecasting the Economic Burden of Autism in 2015 and 2025 in the United States. J. Autism Dev. Disord. 2015, 45, 4135–4139. [Google Scholar] [CrossRef] [PubMed]
- Schumann, C.M.; Bloss, C.S.; Barnes, C.C.; Wideman, G.M.; Carper, R.A.; Akshoomoff, N.; Pierce, K.; Hagler, D.; Schork, N.; Lord, C.; et al. Longitudinal magnetic resonance imaging study of cortical development through early childhood in autism. J. Neurosci. 2010, 30, 4419–4427. [Google Scholar] [CrossRef]
- Tschida, J.E.; Yerys, B.E. A Systematic Review of the Positive Valence System in Autism Spectrum Disorder. Neuropsychol. Rev. 2021, 31, 58–88. [Google Scholar] [CrossRef]
- Weber, C.F.; Lake, E.M.R.; Haider, S.P.; Mozayan, A.; Mukherjee, P.; Scheinost, D.; Bamford, N.S.; Ment, L.; Constable, T.; Payabvash, S. Age-dependent white matter microstructural disintegrity in autism spectrum disorder. Front. Neurosci. 2022, 16, 957018. [Google Scholar] [CrossRef] [PubMed]
- Sharp, T.H.; Elsabbagh, M.; Pickles, A.; Bedford, R. The subcortical correlates of autistic traits in school-age children: A population-based neuroimaging study. Mol. Autism 2023, 14, 6. [Google Scholar] [CrossRef] [PubMed]
- Karunakaran, P.; Hamdan, Y.B. Early Prediction of Autism Spectrum Disorder by Computational Approaches to fMRI Analysis with Early Learning Technique. J. Artif. Intell. Capsul. Netw. 2020, 2, 207–216. [Google Scholar] [CrossRef]
- Xiao, Z.; Qiu, T.; Ke, X.; Xiao, X.; Xiao, T.; Liang, F.; Zou, B.; Huang, H.; Fang, H.; Chu, K.; et al. Autism spectrum disorder as early neurodevelopmental disorder: Evidence from the brain imaging abnormalities in 2–3 years old toddlers. J. Autism Dev. Disord. 2014, 44, 1633–1640. [Google Scholar] [CrossRef]
- Maier, S.; Düppers, A.L.; Runge, K.; Dacko, M.; Lange, T.; Fangmeier, T.; Riedel, A.; Ebert, D.; Endres, D.; Domschke, K.; et al. Increased prefrontal GABA concentrations in adults with autism spectrum disorders. Autism Res. 2022, 15, 1222–1236. [Google Scholar] [CrossRef]
- Wang, H.; Ma, Z.H.; Xu, L.Z.; Yang, L.; Ji, Z.Z.; Tang, X.Z.; Liu, J.R.; Li, X.; Cao, Q.J.; Liu, J. Developmental brain structural atypicalities in autism: A voxel-based morphometry analysis. Child. Adolesc. Psychiatry Ment. Health 2022, 16, 7. [Google Scholar] [CrossRef] [PubMed]
- Nickl-Jockschat, T.; Habel, U.; Michel, T.M.; Manning, J.; Laird, A.R.; Fox, P.T.; Schneider, F.; Eickhoff, S.B. Brain structure anomalies in autism spectrum disorder--a meta-analysis of VBM studies using anatomic likelihood estimation. Hum. Brain Mapp. 2012, 33, 1470–1489. [Google Scholar] [CrossRef] [PubMed]
- Hazlett, H.C.; Gu, H.; Munsell, B.C.; Kim, S.H.; Styner, M.; Wolff, J.J.; Elison, J.T.; Swanson, M.R.; Zhu, H.; Botteron, K.N.; et al. Early brain development in infants at high risk for autism spectrum disorder. Nature 2017, 542, 348–351. [Google Scholar] [CrossRef]
- Courchesne, E.; Pierce, K.; Schumann, C.M.; Redcay, E.; Buckwalter, J.A.; Kennedy, D.P.; Morgan, J. Mapping early brain development in autism. Neuron 2007, 56, 399–413. [Google Scholar] [CrossRef]
- Hazlett, H.C.; Poe, M.D.; Gerig, G.; Styner, M.; Chappell, C.; Smith, R.G.; Vachet, C.; Piven, J. Early brain overgrowth in autism associated with an increase in cortical surface area before age 2 years. Arch. Gen. Psychiatry 2011, 68, 467–476. [Google Scholar] [CrossRef]
- Ohta, H.; Nordahl, C.W.; Iosif, A.M.; Lee, A.; Rogers, S.; Amaral, D.G. Increased Surface Area, but not Cortical Thickness, in a Subset of Young Boys With Autism Spectrum Disorder. Autism Res. 2016, 9, 232–248. [Google Scholar] [CrossRef] [PubMed]
- Liu, J.; Yao, L.; Zhang, W.; Xiao, Y.; Liu, L.; Gao, X.; Shah, C.; Li, S.; Tao, B.; Gong, Q.; et al. Gray matter abnormalities in pediatric autism spectrum disorder: A meta-analysis with signed differential mapping. Eur. Child. Adolesc. Psychiatry 2017, 26, 933–945. [Google Scholar] [CrossRef]
- Guo, X.; Duan, X.; Suckling, J.; Wang, J.; Kang, X.; Chen, H.; Biswal, B.B.; Cao, J.; He, C.; Xiao, J.; et al. Mapping Progressive Gray Matter Alterations in Early Childhood Autistic Brain. Cereb. Cortex 2021, 31, 1500–1510. [Google Scholar] [CrossRef]
- Bai, C.; Wang, Y.; Zhang, Y.; Wang, X.; Chen, Z.; Yu, W.; Zhang, H.; Li, X.; Zhu, K.; Wang, Y.; et al. Abnormal gray matter volume and functional connectivity patterns in social cognition-related brain regions of young children with autism spectrum disorder. Autism Res. 2023, 16, 1124–1137. [Google Scholar] [CrossRef] [PubMed]
- Retico, A.; Giuliano, A.; Tancredi, R.; Cosenza, A.; Apicella, F.; Narzisi, A.; Biagi, L.; Tosetti, M.; Muratori, F.; Calderoni, S. The effect of gender on the neuroanatomy of children with autism spectrum disorders: A support vector machine case-control study. Mol. Autism 2016, 7, 5. [Google Scholar] [CrossRef] [PubMed]
- Li, G.; Chen, M.H.; Li, G.; Wu, D.; Lian, C.; Sun, Q.; Rushmore, R.J.; Wang, L. Volumetric Analysis of Amygdala and Hippocampal Subfields for Infants with Autism. J. Autism Dev. Disord. 2023, 53, 2475–2489. [Google Scholar] [CrossRef]
- Reinhardt, V.P.; Iosif, A.M.; Libero, L.; Heath, B.; Rogers, S.J.; Ferrer, E.; Nordahl, C.; Ghetti, S.; Amaral, D.; Solomon, M. Understanding Hippocampal Development in Young Children With Autism Spectrum Disorder. J. Am. Acad. Child. Adolesc. Psychiatry 2020, 59, 1069–1079. [Google Scholar] [CrossRef] [PubMed]
- Shou, X.J.; Xu, X.J.; Zeng, X.Z.; Liu, Y.; Yuan, H.S.; Xing, Y.; Jia, M.X.; Wei, Q.Y.; Han, S.P.; Zhang, R.; et al. A Volumetric and Functional Connectivity MRI Study of Brain Arginine-Vasopressin Pathways in Autistic Children. Neurosci. Bull. 2017, 33, 130–142. [Google Scholar] [CrossRef]
- Mengotti, P.; D′Agostini, S.; Terlevic, R.; De Colle, C.; Biasizzo, E.; Londero, D.; Ferro, A.; Rambaldelli, G.; Balestrieri, M.; Zanini, S.; et al. Altered white matter integrity and development in children with autism: A combined voxel-based morphometry and diffusion imaging study. Brain Res. Bull. 2011, 84, 189–195. [Google Scholar] [CrossRef]
- Arutiunian, V.; Davydova, E.; Pereverzeva, D.; Sorokin, A.; Tyushkevich, S.; Mamokhina, U.; Danilina, K.; Dragoy, O. Reduced grey matter volume of amygdala and hippocampus is associated with the severity of autistic symptoms and language abilities in school-aged children with Autism Spectrum Disorder: An exploratory study. Brain Struct. Funct. 2023, 228, 1573–1579. [Google Scholar] [CrossRef]
- Sun, F.; Chen, Y.; Gao, Q.; Zhao, Z. Abnormal gray matter structure in children and adolescents with high-functioning autism spectrum disorder. Psychiatry Res. Neuroimaging 2022, 327, 111564. [Google Scholar] [CrossRef]
- Cloarec, R.; Riffault, B.; Dufour, A.; Rabiei, H.; Gouty-Colomer, L.A.; Dumon, C.; Guimond, D.; Bonifazi, P.; Eftekhari, S.; Lozovaya, N.; et al. Pyramidal neuron growth and increased hippocampal volume during labor and birth in autism. Sci. Adv. 2019, 5, eaav0394. [Google Scholar] [CrossRef]
- Becker, E.B.; Stoodley, C.J. Autism spectrum disorder and the cerebellum. Int. Rev. Neurobiol. 2013, 113, 1–34. [Google Scholar] [CrossRef]
- Pote, I.; Wang, S.; Sethna, V.; Blasi, A.; Daly, E.; Kuklisova-Murgasova, M.; Lloyd-Fox, S.; Mercure, E.; Busuulwa, P.; Stoencheva, V.; et al. Familial risk of autism alters subcortical and cerebellar brain anatomy in infants and predicts the emergence of repetitive behaviors in early childhood. Autism Res. 2019, 12, 614–627. [Google Scholar] [CrossRef] [PubMed]
- Yu, K.K.; Cheung, C.; Chua, S.E.; McAlonan, G.M. Can Asperger syndrome be distinguished from autism? An anatomic likelihood meta-analysis of MRI studies. J. Psychiatry Neurosci. 2011, 36, 412–421. [Google Scholar] [CrossRef] [PubMed]
- Cauda, F.; Geda, E.; Sacco, K.; D′Agata, F.; Duca, S.; Geminiani, G.; Keller, R. Grey matter abnormality in autism spectrum disorder: An activation likelihood estimation meta-analysis study. J. Neurol. Neurosurg. Psychiatry 2011, 82, 1304–1313. [Google Scholar] [CrossRef] [PubMed]
- Berretz, G.; Wolf, O.T.; Gunturkun, O.; Ocklenburg, S. Atypical lateralization in neurodevelopmental and psychiatric disorders: What is the role of stress? Cortex 2020, 125, 215–232. [Google Scholar] [CrossRef]
- Cermak, C.A.; Arshinoff, S.; Ribeiro de Oliveira, L.; Tendera, A.; Beal, D.S.; Brian, J.; Anagnostou, E.; Sanjeevan, T. Brain and Language Associations in Autism Spectrum Disorder: A Scoping Review. J. Autism Dev. Disord. 2022, 52, 725–737. [Google Scholar] [CrossRef]
- Braden, B.B.; Riecken, C. Thinning Faster? Age-Related Cortical Thickness Differences in Adults with Autism Spectrum Disorder. Res. Autism Spectr. Disord. 2019, 64, 31–38. [Google Scholar] [CrossRef]
- van Rooij, D.; Anagnostou, E.; Arango, C.; Auzias, G.; Behrmann, M.; Busatto, G.F.; Calderoni, S.; Daly, E.; Deruelle, C.; Di Martino, A.; et al. Cortical and Subcortical Brain Morphometry Differences Between Patients With Autism Spectrum Disorder and Healthy Individuals Across the Lifespan: Results From the ENIGMA ASD Working Group. Am. J. Psychiatry 2018, 175, 359–369. [Google Scholar] [CrossRef]
- Nunes, A.S.; Vakorin, V.A.; Kozhemiako, N.; Peatfield, N.; Ribary, U.; Doesburg, S.M. Atypical age-related changes in cortical thickness in autism spectrum disorder. Sci. Rep. 2020, 10, 11067. [Google Scholar] [CrossRef]
- Zielinski, B.A.; Prigge, M.B.; Nielsen, J.A.; Froehlich, A.L.; Abildskov, T.J.; Anderson, J.S.; Fletcher, P.T.; Zygmunt, K.M.; Travers, B.G.; Lange, N. Longitudinal changes in cortical thickness in autism and typical development. Brain 2014, 137, 1799–1812. [Google Scholar] [CrossRef]
- Doyle-Thomas, K.A.; Duerden, E.G.; Taylor, M.J.; Lerch, J.P.; Soorya, L.V.; Wang, A.T.; Fan, J.; Hollander, E.; Anagnostou, E. Effects of age and symptomatology on cortical thickness in autism spectrum disorders. Res. Autism Spectr. Disord. 2013, 7, 141–150. [Google Scholar] [CrossRef]
- Prigge, M.B.; Bigler, E.D.; Travers, B.G.; Froehlich, A.; Abildskov, T.; Anderson, J.S.; Alexander, A.L.; Lange, N.; Lainhart, J.E.; Zielinski, B.A. Social Responsiveness Scale (SRS) in Relation to Longitudinal Cortical Thickness Changes in Autism Spectrum Disorder. J. Autism Dev. Disord. 2018, 48, 3319–3329. [Google Scholar] [CrossRef] [PubMed]
- Shiohama, T.; Ortug, A.; Warren, J.L.A.; Valli, B.; Levman, J.; Faja, S.K.; Tsujimura, K.; Maunakea, A.K.; Takahashi, E. Small Nucleus Accumbens and Large Cerebral Ventricles in Infants and Toddlers Prior to Receiving Diagnoses of Autism Spectrum Disorder. Cereb. Cortex 2022, 32, 1200–1211. [Google Scholar] [CrossRef] [PubMed]
- Sussman, D.; Leung, R.C.; Vogan, V.M.; Lee, W.; Trelle, S.; Lin, S.; Cassel, D.B.; Chakravarty, M.M.; Lerch, J.P.; Anagnostou, E.; et al. The autism puzzle: Diffuse but not pervasive neuroanatomical abnormalities in children with ASD. Neuroimage Clin. 2015, 8, 170–179. [Google Scholar] [CrossRef] [PubMed]
- Postema, M.C.; van Rooij, D.; Anagnostou, E.; Arango, C.; Auzias, G.; Behrmann, M.; Filho, G.B.; Calderoni, S.; Calvo, R.; Daly, E.; et al. Altered structural brain asymmetry in autism spectrum disorder in a study of 54 datasets. Nat. Commun. 2019, 10, 4958. [Google Scholar] [CrossRef]
- Nielsen, J.A.; Zielinski, B.A.; Fletcher, P.T.; Alexander, A.L.; Lange, N.; Bigler, E.D.; Lainhart, J.E.; Anderson, J.S. Abnormal lateralization of functional connectivity between language and default mode regions in autism. Mol. Autism 2014, 5, 8. [Google Scholar] [CrossRef]
- Ni, H.C.; Lin, H.Y.; Chen, Y.C.; Tseng, W.I.; Gau, S.S. Boys with autism spectrum disorder have distinct cortical folding patterns underpinning impaired self-regulation: A surface-based morphometry study. Brain Imaging Behav. 2020, 14, 2464–2476. [Google Scholar] [CrossRef]
- Ecker, C.; Bookheimer, S.Y.; Murphy, D.G. Neuroimaging in autism spectrum disorder: Brain structure and function across the lifespan. Lancet Neurol. 2015, 14, 1121–1134. [Google Scholar] [CrossRef]
- Kohli, J.S.; Kinnear, M.K.; Fong, C.H.; Fishman, I.; Carper, R.A.; Muller, R.A. Local Cortical Gyrification is Increased in Children With Autism Spectrum Disorders, but Decreases Rapidly in Adolescents. Cereb. Cortex 2019, 29, 2412–2423. [Google Scholar] [CrossRef]
- Yang, D.Y.; Beam, D.; Pelphrey, K.A.; Abdullahi, S.; Jou, R.J. Cortical morphological markers in children with autism: A structural magnetic resonance imaging study of thickness, area, volume, and gyrification. Mol. Autism 2016, 7, 11. [Google Scholar] [CrossRef]
- Libero, L.E.; DeRamus, T.P.; Deshpande, H.D.; Kana, R.K. Surface-based morphometry of the cortical architecture of autism spectrum disorders: Volume, thickness, area, and gyrification. Neuropsychologia 2014, 62, 1–10. [Google Scholar] [CrossRef]
- Ning, M.; Li, C.; Gao, L.; Fan, J. Core-Symptom-Defined Cortical Gyrification Differences in Autism Spectrum Disorder. Front. Psychiatry 2021, 12, 619367. [Google Scholar] [CrossRef] [PubMed]
- Alemany, S.; Blok, E.; Jansen, P.R.; Muetzel, R.L.; White, T. Brain morphology, autistic traits, and polygenic risk for autism: A population-based neuroimaging study. Autism Res. 2021, 14, 2085–2099. [Google Scholar] [CrossRef]
- Zoltowski, A.R.; Lyu, I.; Failla, M.; Mash, L.E.; Dunham, K.; Feldman, J.I.; Woynaroski, T.G.; Wallace, M.T.; Barquero, L.A.; Nguyen, T.Q.; et al. Cortical Morphology in Autism: Findings from a Cortical Shape-Adaptive Approach to Local Gyrification Indexing. Cereb. Cortex 2021, 31, 5188–5205. [Google Scholar] [CrossRef] [PubMed]
- Gao, J.; Chen, M.; Li, Y.; Gao, Y.; Li, Y.; Cai, S.; Wang, J. Multisite Autism Spectrum Disorder Classification Using Convolutional Neural Network Classifier and Individual Morphological Brain Networks. Front. Neurosci. 2020, 14, 629630. [Google Scholar] [CrossRef] [PubMed]
- ElNakieb, Y.; Ali, M.T.; Elnakib, A.; Shalaby, A.; Soliman, A.; Mahmoud, A.; Ghazal, M.; Barnes, G.N.; El-Baz, A. The Role of Diffusion Tensor MR Imaging (DTI) of the Brain in Diagnosing Autism Spectrum Disorder: Promising Results. Sensors 2021, 21, 8171. [Google Scholar] [CrossRef]
- Solso, S.; Xu, R.; Proudfoot, J.; Hagler, D.J., Jr.; Campbell, K.; Venkatraman, V.; Carter Barnes, C.; Ahrens-Barbeau, C.; Pierce, K.; Dale, A.; et al. Diffusion Tensor Imaging Provides Evidence of Possible Axonal Overconnectivity in Frontal Lobes in Autism Spectrum Disorder Toddlers. Biol. Psychiatry 2016, 79, 676–684. [Google Scholar] [CrossRef]
- Ouyang, M.; Cheng, H.; Mishra, V.; Gong, G.; Mosconi, M.W.; Sweeney, J.; Peng, Y.; Huang, H. Atypical age-dependent effects of autism on white matter microstructure in children of 2–7 years. Hum. Brain Mapp. 2016, 37, 819–832. [Google Scholar] [CrossRef]
- Andrews, D.S.; Lee, J.K.; Harvey, D.J.; Waizbard-Bartov, E.; Solomon, M.; Rogers, S.J.; Nordahl, C.W.; Amaral, D.G. A Longitudinal Study of White Matter Development in Relation to Changes in Autism Severity Across Early Childhood. Biol. Psychiatry 2021, 89, 424–432. [Google Scholar] [CrossRef]
- Andrews, D.S.; Lee, J.K.; Solomon, M.; Rogers, S.J.; Amaral, D.G.; Nordahl, C.W. A diffusion-weighted imaging tract-based spatial statistics study of autism spectrum disorder in preschool-aged children. J. Neurodev. Disord. 2019, 11, 32. [Google Scholar] [CrossRef]
- Chen, B.; Linke, A.; Olson, L.; Kohli, J.; Kinnear, M.; Sereno, M.; Muller, R.A.; Carper, R.; Fishman, I. Cortical myelination in toddlers and preschoolers with autism spectrum disorder. Dev. Neurobiol. 2022, 82, 261–274. [Google Scholar] [CrossRef]
- Travers, B.G.; Adluru, N.; Ennis, C.; Tromp, D.P.; Destiche, D.; Doran, S.; Bigler, E.D.; Lange, N.; Lainhart, J.E.; Alexander, A.L. Diffusion tensor imaging in autism spectrum disorder: A review. Autism Res. 2012, 5, 289–313. [Google Scholar] [CrossRef] [PubMed]
- Fu, L.; Li, C.; Li, Y.; Cheng, X.; Cui, X.; Jiang, J.; Ding, N.; Fang, H.; Tang, T.; Ke, X. Heritability of abnormalities in limbic networks of autism spectrum disorder children: Evidence from an autism spectrum disorder twin study. Autism Res. 2022, 15, 628–640. [Google Scholar] [CrossRef] [PubMed]
- Hanaie, R.; Mohri, I.; Kagitani-Shimono, K.; Tachibana, M.; Azuma, J.; Matsuzaki, J.; Watanabe, Y.; Fujita, N.; Taniike, M. Altered microstructural connectivity of the superior cerebellar peduncle is related to motor dysfunction in children with autistic spectrum disorders. Cerebellum 2013, 12, 645–656. [Google Scholar] [CrossRef] [PubMed]
- Hrdlicka, M.; Sanda, J.; Urbanek, T.; Kudr, M.; Dudova, I.; Kickova, S.; Pospisilova, L.; Mohaplova, M.; Maulisova, A.; Krsek, P.; et al. Diffusion Tensor Imaging And Tractography In Autistic, Dysphasic, And Healthy Control Children. Neuropsychiatr. Dis. Treat. 2019, 15, 2843–2852. [Google Scholar] [CrossRef]
- Lei, J.; Lecarie, E.; Jurayj, J.; Boland, S.; Sukhodolsky, D.G.; Ventola, P.; Pelphrey, K.A.; Jou, R.J. Altered Neural Connectivity in Females, But Not Males with Autism: Preliminary Evidence for the Female Protective Effect from a Quality-Controlled Diffusion Tensor Imaging Study. Autism Res. 2019, 12, 1472–1483. [Google Scholar] [CrossRef]
- Weinstein, M.; Ben-Sira, L.; Levy, Y.; Zachor, D.A.; Ben Itzhak, E.; Artzi, M.; Tarrasch, R.; Eksteine, P.M.; Hendler, T.; Ben Bashat, D. Abnormal white matter integrity in young children with autism. Hum. Brain Mapp. 2011, 32, 534–543. [Google Scholar] [CrossRef] [PubMed]
- Fingher, N.; Dinstein, I.; Ben-Shachar, M.; Haar, S.; Dale, A.M.; Eyler, L.; Pierce, K.; Courchesne, E. Toddlers later diagnosed with autism exhibit multiple structural abnormalities in temporal corpus callosum fibers. Cortex 2017, 97, 291–305. [Google Scholar] [CrossRef]
- Fletcher, P.T.; Whitaker, R.T.; Tao, R.; DuBray, M.B.; Froehlich, A.; Ravichandran, C.; Alexander, A.L.; Bigler, E.D.; Lange, N.; Lainhart, J.E. Microstructural connectivity of the arcuate fasciculus in adolescents with high-functioning autism. Neuroimage 2010, 51, 1117–1125. [Google Scholar] [CrossRef]
- Peterson, D.; Mahajan, R.; Crocetti, D.; Mejia, A.; Mostofsky, S. Left-hemispheric microstructural abnormalities in children with high-functioning autism spectrum disorder. Autism Res. 2015, 8, 61–72. [Google Scholar] [CrossRef]
- Walker, L.; Gozzi, M.; Lenroot, R.; Thurm, A.; Behseta, B.; Swedo, S.; Pierpaoli, C. Diffusion tensor imaging in young children with autism: Biological effects and potential confounds. Biol. Psychiatry 2012, 72, 1043–1051. [Google Scholar] [CrossRef]
- Conti, E.; Calderoni, S.; Gaglianese, A.; Pannek, K.; Mazzotti, S.; Rose, S.; Scelfo, D.; Tosetti, M.; Muratori, F.; Cioni, G.; et al. Lateralization of Brain Networks and Clinical Severity in Toddlers with Autism Spectrum Disorder: A HARDI Diffusion MRI Study. Autism Res. 2016, 9, 382–392. [Google Scholar] [CrossRef] [PubMed]
- Fu, L.; Wang, Y.; Fang, H.; Xiao, X.; Xiao, T.; Li, Y.; Li, C.; Wu, Q.; Chu, K.; Xiao, C.; et al. Longitudinal Study of Brain Asymmetries in Autism and Developmental Delays Aged 2–5 years. Neuroscience 2020, 432, 137–149. [Google Scholar] [CrossRef] [PubMed]
- Qin, B.; Wang, L.; Zhang, Y.; Cai, J.; Chen, J.; Li, T. Enhanced Topological Network Efficiency in Preschool Autism Spectrum Disorder: A Diffusion Tensor Imaging Study. Front. Psychiatry 2018, 9, 278. [Google Scholar] [CrossRef]
- Li, S.J.; Wang, Y.; Qian, L.; Liu, G.; Liu, S.F.; Zou, L.P.; Zhang, J.S.; Hu, N.; Chen, X.Q.; Yu, S.Y.; et al. Alterations of White Matter Connectivity in Preschool Children with Autism Spectrum Disorder. Radiology 2018, 288, 209–217. [Google Scholar] [CrossRef]
- Qian, L.; Li, Y.; Wang, Y.; Wang, Y.; Cheng, X.; Li, C.; Cui, X.; Jiao, G.; Ke, X. Shared and Distinct Topologically Structural Connectivity Patterns in Autism Spectrum Disorder and Attention-Deficit/Hyperactivity Disorder. Front. Neurosci. 2021, 15, 664363. [Google Scholar] [CrossRef] [PubMed]
- Cai, Y.; Zhao, J.; Wang, L.; Xie, Y.; Fan, X. Altered topological properties of white matter structural network in adults with autism spectrum disorder. Asian J. Psychiatry 2022, 75, 103211. [Google Scholar] [CrossRef]
- Qian, L.; Wang, Y.; Chu, K.; Li, Y.; Xiao, C.; Xiao, T.; Xiao, X.; Qiu, T.; Xiao, Y.; Fang, H.; et al. Alterations in hub organization in the white matter structural network in toddlers with autism spectrum disorder: A 2-year follow-up study. Autism Res. 2018, 11, 1218–1228. [Google Scholar] [CrossRef]
- Li, C.; Li, Y.; Fu, L.; Wang, Y.; Cheng, X.; Cui, X.; Jiang, J.; Xiao, T.; Ke, X.; Fang, H. The relationships between the topological properties of the whole-brain white matter network and the severity of autism spectrum disorder: A study from monozygotic twins. Neuroscience 2021, 465, 60–70. [Google Scholar] [CrossRef]
- Kim, J.I.; Bang, S.; Yang, J.J.; Kwon, H.; Jang, S.; Roh, S.; Kim, S.H.; Kim, M.J.; Lee, H.J.; Lee, J.M.; et al. Classification of Preschoolers with Low-Functioning Autism Spectrum Disorder Using Multimodal MRI Data. J. Autism Dev. Disord. 2023, 53, 25–37. [Google Scholar] [CrossRef]
- Helmy, E.; Elnakib, A.; ElNakieb, Y.; Khudri, M.; Abdelrahim, M.; Yousaf, J.; Ghazal, M.; Contractor, S.; Barnes, G.N.; El-Baz, A. Role of Artificial Intelligence for Autism Diagnosis Using DTI and fMRI: A Survey. Biomedicines 2023, 11, 1858. [Google Scholar] [CrossRef]
- Yan, W.; Rangaprakash, D.; Deshpande, G. Aberrant hemodynamic responses in autism: Implications for resting state fMRI functional connectivity studies. NeuroImage Clin. 2018, 19, 320–330. [Google Scholar] [CrossRef] [PubMed]
- Li, X.; Zhang, K.; He, X.; Zhou, J.; Jin, C.; Shen, L.; Gao, Y.; Tian, M.; Zhang, H. Structural, Functional, and Molecular Imaging of Autism Spectrum Disorder. Neurosci. Bull. 2021, 37, 1051–1071. [Google Scholar] [CrossRef] [PubMed]
- Holiga, Š.; Hipp, J.F.; Chatham, C.H.; Garces, P.; Spooren, W.; D′Ardhuy, X.L.; Bertolino, A.; Bouquet, C.; Buitelaar, J.K.; Bours, C.; et al. Patients with autism spectrum disorders display reproducible functional connectivity alterations. Sci. Transl. Med. 2019, 11, eaat9223. [Google Scholar] [CrossRef] [PubMed]
- Buckner, R.L.; Andrews-Hanna, J.R.; Schacter, D.L. The brain′s default network: Anatomy, function, and relevance to disease. Ann. N. Y. Acad. Sci. 2008, 1124, 1–38. [Google Scholar] [CrossRef]
- Menon, V.; Uddin, L.Q. Saliency, switching, attention and control: A network model of insula function. Brain Struct. Funct. 2010, 214, 655–667. [Google Scholar] [CrossRef]
- Seeley, W.W. The Salience Network: A Neural System for Perceiving and Responding to Homeostatic Demands. J. Neurosci. 2019, 39, 9878–9882. [Google Scholar] [CrossRef]
- Seeley, W.W.; Menon, V.; Schatzberg, A.F.; Keller, J.; Glover, G.H.; Kenna, H.; Reiss, A.L.; Greicius, M.D. Dissociable intrinsic connectivity networks for salience processing and executive control. J. Neurosci. 2007, 27, 2349–2356. [Google Scholar] [CrossRef]
- Spreng, R.N.; Sepulcre, J.; Turner, G.R.; Stevens, W.D.; Schacter, D.L. Intrinsic architecture underlying the relations among the default, dorsal attention, and frontoparietal control networks of the human brain. J. Cogn. Neurosci. 2013, 25, 74–86. [Google Scholar] [CrossRef]
- Burrows, C.A.; Laird, A.R.; Uddin, L.Q. Functional connectivity of brain regions for self- and other-evaluation in children, adolescents and adults with autism. Dev. Sci. 2016, 19, 564–580. [Google Scholar] [CrossRef]
- Haghighat, H.; Mirzarezaee, M.; Araabi, B.N.; Khadem, A. Functional Networks Abnormalities in Autism Spectrum Disorder: Age-Related Hypo and Hyper Connectivity. Brain Topogr. 2021, 34, 306–322. [Google Scholar] [CrossRef]
- Xiao, Y.; Wen, T.H.; Kupis, L.; Eyler, L.T.; Taluja, V.; Troxel, J.; Goel, D.; Lombardo, M.V.; Pierce, K.; Courchesne, E. Atypical functional connectivity of temporal cortex with precuneus and visual regions may be an early-age signature of ASD. Mol. Autism 2023, 14, 11. [Google Scholar] [CrossRef] [PubMed]
- McKinnon, C.J.; Eggebrecht, A.T.; Todorov, A.; Wolff, J.J.; Elison, J.T.; Adams, C.M.; Snyder, A.Z.; Estes, A.M.; Zwaigenbaum, L.; Botteron, K.N.; et al. Restricted and Repetitive Behavior and Brain Functional Connectivity in Infants at Risk for Developing Autism Spectrum Disorder. Biol. Psychiatry Cogn. Neurosci. Neuroimaging 2019, 4, 50–61. [Google Scholar] [CrossRef] [PubMed]
- Chen, B.; Linke, A.; Olson, L.; Ibarra, C.; Reynolds, S.; Müller, R.A.; Kinnear, M.; Fishman, I. Greater functional connectivity between sensory networks is related to symptom severity in toddlers with autism spectrum disorder. J. Child. Psychol. Psychiatry 2021, 62, 160–170. [Google Scholar] [CrossRef] [PubMed]
- Chen, H.; Wang, J.; Uddin, L.Q.; Wang, X.; Guo, X.; Lu, F.; Duan, X.; Wu, L.; Chen, H. Aberrant functional connectivity of neural circuits associated with social and sensorimotor deficits in young children with autism spectrum disorder. Autism Res. 2018, 11, 1643–1652. [Google Scholar] [CrossRef] [PubMed]
- Uddin, L.Q.; Supekar, K.; Menon, V. Reconceptualizing functional brain connectivity in autism from a developmental perspective. Front. Hum. Neurosci. 2013, 7, 458. [Google Scholar] [CrossRef] [PubMed]
- Nomi, J.S.; Uddin, L.Q. Developmental changes in large-scale network connectivity in autism. Neuroimage Clin. 2015, 7, 732–741. [Google Scholar] [CrossRef]
- Farrant, K.; Uddin, L.Q. Atypical developmental of dorsal and ventral attention networks in autism. Dev. Sci. 2016, 19, 550–563. [Google Scholar] [CrossRef]
- Nunes, A.S.; Peatfield, N.; Vakorin, V.; Doesburg, S.M. Idiosyncratic organization of cortical networks in autism spectrum disorder. Neuroimage 2019, 190, 182–190. [Google Scholar] [CrossRef]
- Yerys, B.E.; Gordon, E.M.; Abrams, D.N.; Satterthwaite, T.D.; Weinblatt, R.; Jankowski, K.F.; Strang, J.; Kenworthy, L.; Gaillard, W.D.; Vaidya, C.J. Default mode network segregation and social deficits in autism spectrum disorder: Evidence from non-medicated children. Neuroimage Clin. 2015, 9, 223–232. [Google Scholar] [CrossRef]
- Yerys, B.E.; Herrington, J.D.; Satterthwaite, T.D.; Guy, L.; Schultz, R.T.; Bassett, D.S. Globally weaker and topologically different: Resting-state connectivity in youth with autism. Mol. Autism 2017, 8, 39. [Google Scholar] [CrossRef]
- Morgan, B.R.; Ibrahim, G.M.; Vogan, V.M.; Leung, R.C.; Lee, W.; Taylor, M.J. Characterization of Autism Spectrum Disorder across the Age Span by Intrinsic Network Patterns. Brain Topogr. 2019, 32, 461–471. [Google Scholar] [CrossRef] [PubMed]
- Ilioska, I.; Oldehinkel, M.; Llera, A.; Chopra, S.; Looden, T.; Chauvin, R.; Van Rooij, D.; Floris, D.L.; Tillmann, J.; Moessnang, C.; et al. Connectome-wide Mega-analysis Reveals Robust Patterns of Atypical Functional Connectivity in Autism. Biol. Psychiatry 2023, 94, 29–39. [Google Scholar] [CrossRef] [PubMed]
- Abbott, A.E.; Nair, A.; Keown, C.L.; Datko, M.; Jahedi, A.; Fishman, I.; Muller, R.A. Patterns of Atypical Functional Connectivity and Behavioral Links in Autism Differ Between Default, Salience, and Executive Networks. Cereb. Cortex 2016, 26, 4034–4045. [Google Scholar] [CrossRef] [PubMed]
- Liu, X.; Huang, H. Alterations of functional connectivities associated with autism spectrum disorder symptom severity: A multi-site study using multivariate pattern analysis. Sci. Rep. 2020, 10, 4330. [Google Scholar] [CrossRef]
- Monk, C.S.; Peltier, S.J.; Wiggins, J.L.; Weng, S.J.; Carrasco, M.; Risi, S.; Lord, C. Abnormalities of intrinsic functional connectivity in autism spectrum disorders. Neuroimage 2009, 47, 764–772. [Google Scholar] [CrossRef]
- von dem Hagen, E.A.; Stoyanova, R.S.; Baron-Cohen, S.; Calder, A.J. Reduced functional connectivity within and between ′social′ resting state networks in autism spectrum conditions. Soc. Cogn. Affect. Neurosci. 2013, 8, 694–701. [Google Scholar] [CrossRef]
- Dickie, E.W.; Ameis, S.H.; Shahab, S.; Calarco, N.; Smith, D.E.; Miranda, D.; Viviano, J.D.; Voineskos, A.N. Personalized Intrinsic Network Topography Mapping and Functional Connectivity Deficits in Autism Spectrum Disorder. Biol. Psychiatry 2018, 84, 278–286. [Google Scholar] [CrossRef]
- Lorenzini, L.; van Wingen, G.; Cerliani, L. Atypically high influence of subcortical activity on primary sensory regions in autism. Neuroimage Clin. 2021, 32, 102839. [Google Scholar] [CrossRef]
- Oldehinkel, M.; Mennes, M.; Marquand, A.; Charman, T.; Tillmann, J.; Ecker, C.; Dell′Acqua, F.; Brandeis, D.; Banaschewski, T.; Baumeister, S.; et al. Altered Connectivity Between Cerebellum, Visual, and Sensory-Motor Networks in Autism Spectrum Disorder: Results from the EU-AIMS Longitudinal European Autism Project. Biol. Psychiatry Cogn. Neurosci. Neuroimaging 2019, 4, 260–270. [Google Scholar] [CrossRef]
- Sha, Z.; van Rooij, D.; Anagnostou, E.; Arango, C.; Auzias, G.; Behrmann, M.; Bernhardt, B.; Bolte, S.; Busatto, G.F.; Calderoni, S.; et al. Subtly altered topological asymmetry of brain structural covariance networks in autism spectrum disorder across 43 datasets from the ENIGMA consortium. Mol. Psychiatry 2022, 27, 2114–2125. [Google Scholar] [CrossRef]
- Floris, D.L.; Barber, A.D.; Nebel, M.B.; Martinelli, M.; Lai, M.C.; Crocetti, D.; Baron-Cohen, S.; Suckling, J.; Pekar, J.J.; Mostofsky, S.H. Atypical lateralization of motor circuit functional connectivity in children with autism is associated with motor deficits. Mol. Autism 2016, 7, 35. [Google Scholar] [CrossRef]
- Sylvester, C.M.; Kaplan, S.; Myers, M.J.; Gordon, E.M.; Schwarzlose, R.F.; Alexopoulos, D.; Nielsen, A.N.; Kenley, J.K.; Meyer, D.; Yu, Q. Network-specific selectivity of functional connections in the neonatal brain. Cereb. Cortex 2023, 33, 2200–2214. [Google Scholar] [CrossRef] [PubMed]
- Du, Y.; He, X.; Kochunov, P.; Pearlson, G.; Hong, L.E.; van Erp, T.G.M.; Belger, A.; Calhoun, V.D. A new multimodality fusion classification approach to explore the uniqueness of schizophrenia and autism spectrum disorder. Hum. Brain Mapp. 2022, 43, 3887–3903. [Google Scholar] [CrossRef] [PubMed]
- Tang, S.; Liu, X.; Ran, Q.; Nie, L.; Wu, L.; Pan, Z.; He, L. Application of Three-Dimensional Pseudocontinuous Arterial Spin Labeling Perfusion Imaging in the Brains of Children With Autism. Front. Neurol. 2022, 13, 851430. [Google Scholar] [CrossRef]
- Ye, F.; Du, L.; Liu, B.; Gao, X.; Yang, A.; Liu, D.; Chen, Y.; Lv, K.; Xu, P.; Chen, Y.; et al. Application of pseudocontinuous arterial spin labeling perfusion imaging in children with autism spectrum disorders. Front. Neurosci. 2022, 16, 1045585. [Google Scholar] [CrossRef] [PubMed]
- Mori, T.; Ito, H.; Harada, M.; Hisaoka, S.; Matsumoto, Y.; Goji, A.; Toda, Y.; Mori, K.; Kagami, S. Multi-delay arterial spin labeling brain magnetic resonance imaging study for pediatric autism. Brain Dev. 2020, 42, 315–321. [Google Scholar] [CrossRef]
- Tang, S.L.; Nie, L.S.; Liu, X.F.; Chen, Z.; Zhou, Y.; Pan, Z.X.; He, L. Application of Quantitative Magnetic Resonance Imaging in the Diagnosis of Autism in Children. Front. Med. 2022, 9, 12. [Google Scholar] [CrossRef] [PubMed]
- Mori, K.; Toda, Y.; Ito, H.; Mori, T.; Goji, A.; Fujii, E.; Miyazaki, M.; Harada, M.; Kagami, S. A proton magnetic resonance spectroscopic study in autism spectrum disorders: Amygdala and orbito-frontal cortex. Brain Dev. 2013, 35, 139–145. [Google Scholar] [CrossRef]
- Goji, A.; Ito, H.; Mori, K.; Harada, M.; Hisaoka, S.; Toda, Y.; Mori, T.; Abe, Y.; Miyazaki, M.; Kagami, S. Assessment of Anterior Cingulate Cortex (ACC) and Left Cerebellar Metabolism in Asperger′s Syndrome with Proton Magnetic Resonance Spectroscopy (MRS). PLoS ONE 2017, 12, e0169288. [Google Scholar] [CrossRef]
- Margari, L.; De Giacomo, A.; Craig, F.; Palumbi, R.; Peschechera, A.; Margari, M.; Picardi, F.; Caldarola, M.; Maghenzani, M.A.; Dicuonzo, F. Frontal lobe metabolic alterations in autism spectrum disorder: A (1)H-magnetic resonance spectroscopy study. Neuropsychiatr. Dis. Treat. 2018, 14, 1871–1876. [Google Scholar] [CrossRef]
- DeMayo, M.M.; Harris, A.D.; Song, Y.J.C.; Pokorski, I.; Thapa, R.; Patel, S.; Ambarchi, Z.; Thomas, E.E.; Hickie, I.B.; Guastella, A.J. Age-related parietal GABA alterations in children with autism spectrum disorder. Autism Res. 2021, 14, 859–872. [Google Scholar] [CrossRef] [PubMed]
- Ito, H.; Mori, K.; Harada, M.; Hisaoka, S.; Toda, Y.; Mori, T.; Goji, A.; Abe, Y.; Miyazaki, M.; Kagami, S. A Proton Magnetic Resonance Spectroscopic Study in Autism Spectrum Disorder Using a 3-Tesla Clinical Magnetic Resonance Imaging (MRI) System: The Anterior Cingulate Cortex and the Left Cerebellum. J. Child. Neurol. 2017, 32, 731–739. [Google Scholar] [CrossRef]
- Yerys, B.E.; Herrington, J.D.; Bartley, G.K.; Liu, H.S.; Detre, J.A.; Schultz, R.T. Arterial spin labeling provides a reliable neurobiological marker of autism spectrum disorder. J. Neurodev. Disord. 2018, 10, 32. [Google Scholar] [CrossRef] [PubMed]
- Jann, K.; Hernandez, L.M.; Beck-Pancer, D.; McCarron, R.; Smith, R.X.; Dapretto, M.; Wang, D.J. Altered resting perfusion and functional connectivity of default mode network in youth with autism spectrum disorder. Brain Behav. 2015, 5, e00358. [Google Scholar] [CrossRef] [PubMed]
- Peterson, B.S.; Zargarian, A.; Peterson, J.B.; Goh, S.; Sawardekar, S.; Williams, S.C.R.; Lythgoe, D.J.; Zelaya, F.O.; Bansal, R. Hyperperfusion of Frontal White and Subcortical Gray Matter in Autism Spectrum Disorder. Biol. Psychiatry 2019, 85, 584–595. [Google Scholar] [CrossRef]
- Liang, X.; Zou, Q.; He, Y.; Yang, Y. Coupling of functional connectivity and regional cerebral blood flow reveals a physiological basis for network hubs of the human brain. Proc. Natl. Acad. Sci. USA 2013, 110, 1929–1934. [Google Scholar] [CrossRef]
- Du, Y.; Chen, L.; Yan, M.C.; Wang, Y.L.; Zhong, X.L.; Xv, C.X.; Li, Y.B.; Cheng, Y. Neurometabolite levels in the brains of patients with autism spectrum disorders: A meta-analysis of proton magnetic resonance spectroscopy studies (N = 1501). Mol. Psychiatry, 2023; online ahead of print. [Google Scholar] [CrossRef]
- Kang, Q.Q.; Li, X.; Tong, G.L.; Fan, Y.L.; Shi, L. Magnetic resonance spectroscopy features of the thalamus and the cerebellum and their association with clinical features in children with autism spectrum disorder: A prospective study. Zhongguo Dang Dai Er Ke Za Zhi 2021, 23, 1250–1255. [Google Scholar] [CrossRef]
- Mori, K.; Toda, Y.; Ito, H.; Mori, T.; Mori, K.; Goji, A.; Hashimoto, H.; Tani, H.; Miyazaki, M.; Harada, M.; et al. Neuroimaging in autism spectrum disorders- 1H-MRS and NIRS study. J. Med. Investig. 2015, 62, 29–36. [Google Scholar] [CrossRef]
- Hegarty, J.P., II; Gu, M.; Spielman, D.M.; Cleveland, S.C.; Hallmayer, J.F.; Lazzeroni, L.C.; Raman, M.M.; Frazier, T.W.; Phillips, J.M.; Reiss, A.L.; et al. A proton MR spectroscopy study of the thalamus in twins with autism spectrum disorder. Prog. Neuropsychopharmacol. Biol. Psychiatry 2018, 81, 153–160. [Google Scholar] [CrossRef]
- Jimenez-Espinoza, C.; Marcano Serrano, F.; Gonzalez-Mora, J.L. N-Acetylaspartyl-Glutamate Metabolism in the Cingulated Cortices as a Biomarker of the Etiology in ASD: A (1)H-MRS Model. Molecules 2021, 26, 675. [Google Scholar] [CrossRef]
- Ford, T.C.; Crewther, D.P. A Comprehensive Review of the (1)H-MRS Metabolite Spectrum in Autism Spectrum Disorder. Front. Mol. Neurosci. 2016, 9, 14. [Google Scholar] [CrossRef] [PubMed]
- Hardan, A.Y.; Fung, L.K.; Frazier, T.; Berquist, S.W.; Minshew, N.J.; Keshavan, M.S.; Stanley, J.A. A proton spectroscopy study of white matter in children with autism. Prog. Neuropsychopharmacol. Biol. Psychiatry 2016, 66, 48–53. [Google Scholar] [CrossRef]
- Puts, N.A.J.; Wodka, E.L.; Harris, A.D.; Crocetti, D.; Tommerdahl, M.; Mostofsky, S.H.; Edden, R.A.E. Reduced GABA and altered somatosensory function in children with autism spectrum disorder. Autism Res. 2017, 10, 608–619. [Google Scholar] [CrossRef] [PubMed]
- Brix, M.K.; Ersland, L.; Hugdahl, K.; Gruner, R.; Posserud, M.B.; Hammar, A.; Craven, A.R.; Noeske, R.; Evans, C.J.; Walker, H.B.; et al. Brain MR spectroscopy in autism spectrum disorder-the GABA excitatory/inhibitory imbalance theory revisited. Front. Hum. Neurosci. 2015, 9, 365. [Google Scholar] [CrossRef] [PubMed]
- Ajram, L.A.; Pereira, A.C.; Durieux, A.M.S.; Velthius, H.E.; Petrinovic, M.M.; McAlonan, G.M. The contribution of [1H] magnetic resonance spectroscopy to the study of excitation-inhibition in autism. Prog. Neuropsychopharmacol. Biol. Psychiatry 2019, 89, 236–244. [Google Scholar] [CrossRef]
- Hwang, B.J.; Mohamed, M.A.; Brasic, J.R. Molecular imaging of autism spectrum disorder. Int. Rev. Psychiatry 2017, 29, 530–554. [Google Scholar] [CrossRef]
- Park, G.; Jeon, S.J.; Ko, I.O.; Park, J.H.; Lee, K.C.; Kim, M.S.; Shin, C.Y.; Kim, H.; Lee, Y.S. Decreased in vivo glutamate/GABA ratio correlates with the social behavior deficit in a mouse model of autism spectrum disorder. Mol. Brain 2022, 15, 19. [Google Scholar] [CrossRef]
- Drenthen, G.S.; Barendse, E.M.; Aldenkamp, A.P.; van Veenendaal, T.M.; Puts, N.A.; Edden, R.A.; Zinger, S.; Thoonen, G.; Hendriks, M.P.; Kessels, R.P.; et al. Altered neurotransmitter metabolism in adolescents with high-functioning autism. Psychiatry Res. Neuroimaging 2016, 256, 44–49. [Google Scholar] [CrossRef]
- Bernardino, I.; Dionisio, A.; Violante, I.R.; Monteiro, R.; Castelo-Branco, M. Motor Cortex Excitation/Inhibition Imbalance in Young Adults With Autism Spectrum Disorder: A MRS-TMS Approach. Front. Psychiatry 2022, 13, 860448. [Google Scholar] [CrossRef]
- Klostranec, J.M.; Vucevic, D.; Bhatia, K.D.; Kortman, H.G.J.; Krings, T.; Murphy, K.P.; terBrugge, K.G.; Mikulis, D.J. Current Concepts in Intracranial Interstitial Fluid Transport and the Glymphatic System: Part I-Anatomy and Physiology. Radiology 2021, 301, 502–514. [Google Scholar] [CrossRef]
- Shen, M.D.; Nordahl, C.W.; Li, D.D.; Lee, A.; Angkustsiri, K.; Emerson, R.W.; Rogers, S.J.; Ozonoff, S.; Amaral, D.G. Extra-axial cerebrospinal fluid in high-risk and normal-risk children with autism aged 2–4 years: A case-control study. Lancet Psychiatry 2018, 5, 895–904. [Google Scholar] [CrossRef] [PubMed]
- Taber, K.H.; Shaw, J.B.; Loveland, K.A.; Pearson, D.A.; Lane, D.M.; Hayman, L.A. Accentuated Virchow-Robin spaces in the centrum semiovale in children with autistic disorder. Comput. Assist. Tomogr. 2004, 28, 263–268. [Google Scholar] [CrossRef] [PubMed]
- Li, X.; Ruan, C.; Zibrila, A.I.; Musa, M.; Wu, Y.; Zhang, Z.; Liu, H.; Salimeen, M. Children with autism spectrum disorder present glymphatic system dysfunction evidenced by diffusion tensor imaging along the perivascular space. Medicine 2022, 101, e32061. [Google Scholar] [CrossRef] [PubMed]
- Shen, M.D.; Kim, S.H.; McKinstry, R.C.; Gu, H.; Hazlett, H.C.; Nordahl, C.W.; Emerson, R.W.; Shaw, D.; Elison, J.T.; Swanson, M.R.; et al. Increased Extra-axial Cerebrospinal Fluid in High-Risk Infants Who Later Develop Autism. Biol. Psychiatry 2017, 82, 186–193. [Google Scholar] [CrossRef] [PubMed]
- Xu, H.; Lehtinen, M.K. Cerebrospinal Fluid Magnetic Resonance Imaging: Improving Early Diagnosis of Autism and Other Neurodevelopmental Conditions. Biol. Psychiatry Cogn. Neurosci. Neuroimaging 2020, 5, 635–637. [Google Scholar] [CrossRef]
- Peterson, M.; Prigge, M.B.D.; Bigler, E.D.; Zielinski, B.; King, J.B.; Lange, N.; Alexander, A.; Lainhart, J.E.; Nielsen, J.A. Evidence for normal extra-axial cerebrospinal fluid volume in autistic males from middle childhood to adulthood. Neuroimage 2021, 240, 118387. [Google Scholar] [CrossRef]
- Diem, A.K.; Carare, R.O.; Weller, R.O.; Bressloff, N.W. A control mechanism for intra-mural peri-arterial drainage via astrocytes: How neuronal activity could improve waste clearance from the brain. PLoS ONE 2018, 13, e0205276. [Google Scholar] [CrossRef]