1. Introduction
Folic acid (FA), also known as vitamin B9, is necessary for the healthy functioning of various processes occurring in the body, such as DNA synthesis, DNA repair processes, catecholamine and pyrimidine synthesis, purine synthesis, and the conversion of homocysteine to methionine [1,2,3,4,5]. Conversely, folic acid deficiency is associated with conditions such as megaloblastic anemia, elevated homocysteine levels, cardiovascular diseases, and neural tube defects in fetuses (e.g., anencephaly or spina bifida) [6,7]. In the gestational period, FA promotes the fetus’s growth and development, expands the placenta’s blood vessels, and increases blood supply [8,9]. However, the human body cannot produce this substance. Therefore, the recommended dietary intake (RDA) for folate is 400 µg/day in adults and 600 µg/day in pregnant women [10,11]. According to an extensive review by Czeizel et al. [12], periconceptional supplementation can prevent neuronal tube malformations in newborns by 70%. To meet the demand for these substances, pregnant women must consume this particular nutrient to prevent malformation of nervous system organs in the fetus and contribute to the normal homocysteine metabolism.
FA is an active pharmaceutical ingredient (API) classified as a class IV compound according to the BCS due to its low permeability (1.7 × 10⁻⁶ cm/s) [13] and low solubility (1.6 mg/L) [14] (see Figure 1). The common approach to increase its solubility is to prescribe the sodium salt form. However, sodium intake formulations should be limited in people with hypertension since 5% to 10% of pregnancies worldwide are complicated by hypertensive disorders [15]. Sodium-free formulations are desirable to increase the solubility of FA. Moreover, poorly water-soluble drugs often require high doses to reach therapeutic plasma concentration after oral administration [16].
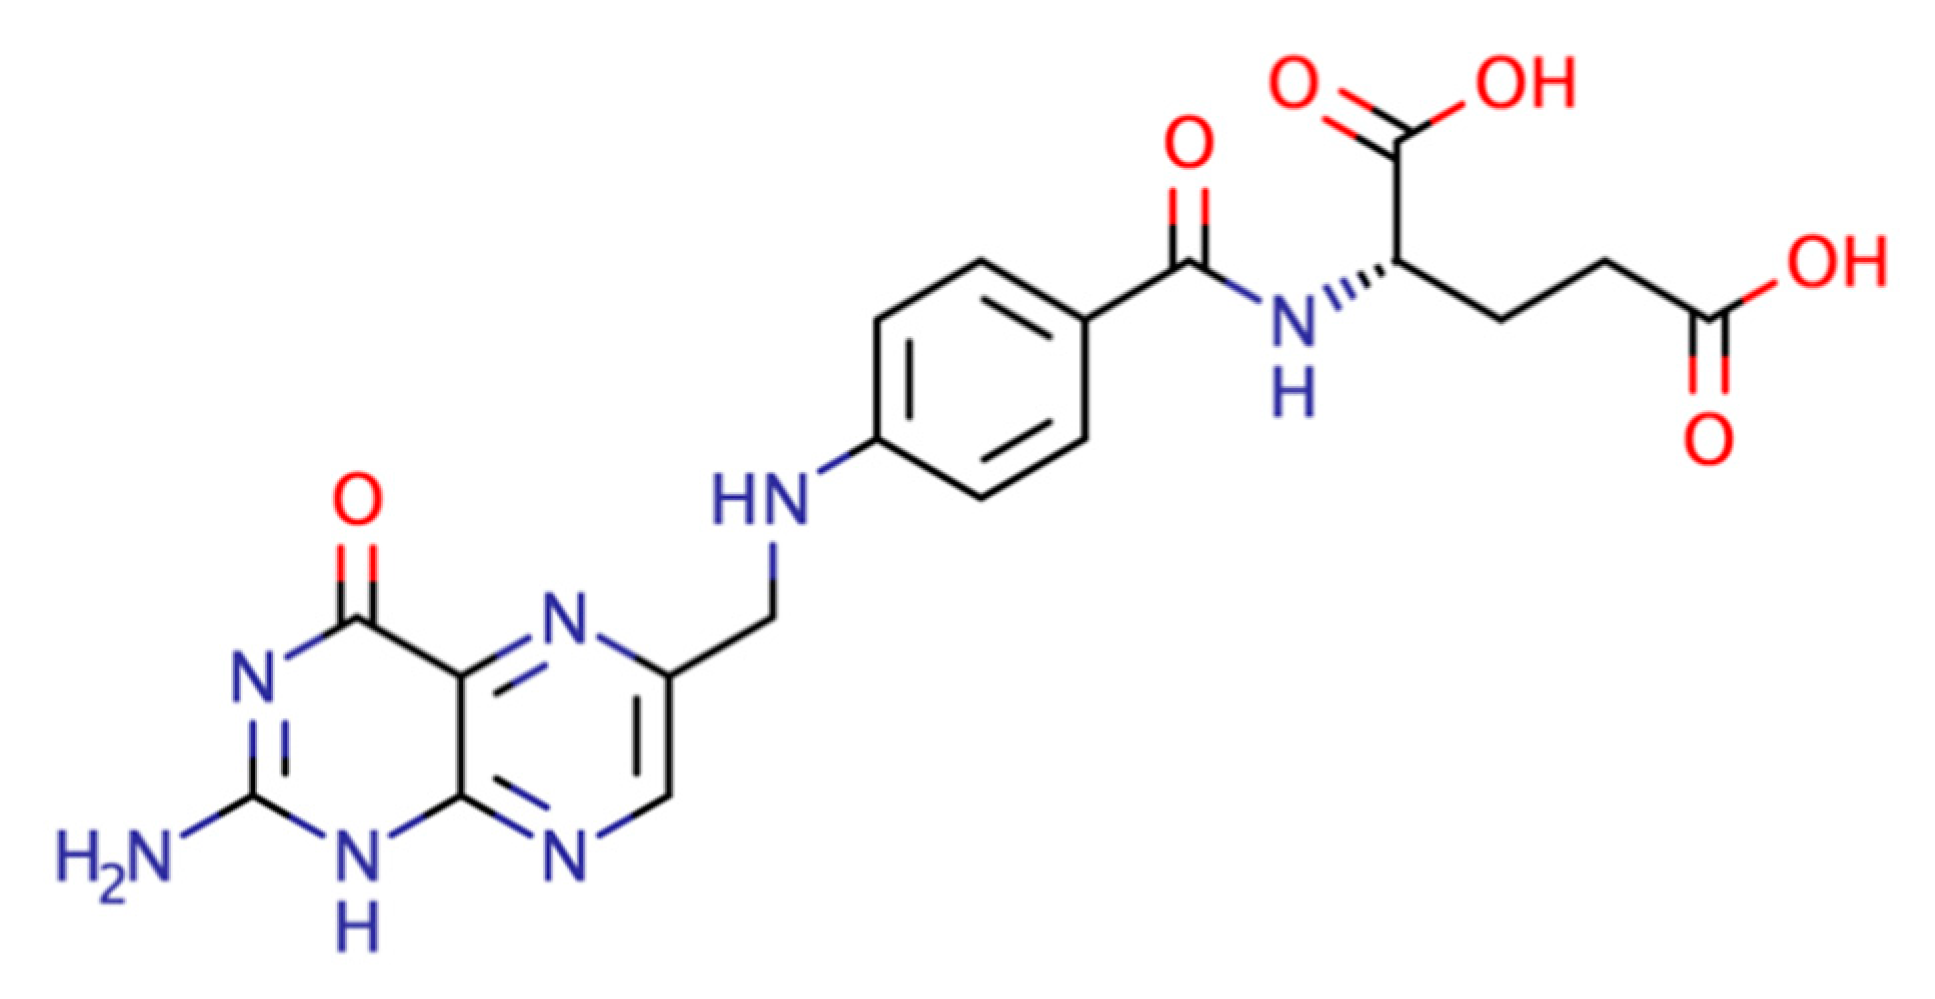
Figure 1. Folic acid structure.
Most commercially available tablet formulations stumble with the dissolution of FA since these exhibit different dissolution rates and low dissolution levels, failing to meet USP (US Pharmacopeia) requirements; this severely affects the therapeutic dose needed for specific supplementation required (e.g., pregnant women with NTDs history) [17,18]. Therefore, the search for methodologies to enhance solubility and permeability is highly relevant.
There are several strategies to enhance the solubility of an active pharmaceutic ingredient (API) with an acidic nature, such as FA, one of which is using a co-former with a basic character to form a salt with a better interaction with water and thus enhancing its solubility. Salt systems are composed of an ionizable acid or donor (base or acceptor) API and a conjugate co-former, which results in an adduct with cationic and anionic characteristics [19,20,21,22]. Salt formation has become an essential step in pharmaceutical development, and it is widely used in the industry to improve the solubility and dissolution rate of poorly soluble drugs [23].
Based on the arrangement of the molecules or ions, either a crystalline or an amorphous system may form [23]. A crystalline structure will have a well-defined distribution of the molecules in a crystalline lattice, while in an amorphous structure, molecules present a short-range disorder. Amorphization is the transformation of an API from its crystalline form into its amorphous state, where crystalline order is absent. In this state, solubility improvement is observed, given that structurally disordered materials have higher free energy than their crystalline form, increasing the spontaneity of their dissolution [24,25,26,27,28,29,30,31,32]. Salt formation and amorphization are good alternatives to achieving solubility enhancement of poorly soluble drugs [28]. Furthermore, the use of amino acids (AA) as co-formers has been studied and found to be reliable as they have low molecular weight, are common constituents of the daily diet, and are non-toxic [33,34]. Also, the variety of functional groups in their side chains may lead to a wide range of interactions that could result in a formulation with an API’s desired stability and high solubility [35].
Acid–base interactions may lead to solubilities exceeding the pure low-solubility APIs [36]. Various studies have reported the enhancement achieved with formulations of acid-APIs combined with basic AA, such as arginine (ARG) and lysine (LYS), which have amino groups in their side chain (see Figure 2) [34]. These groups provide a basic reactivity toward the acidic functional groups of the selected API to form a salt. Regarding the formation of salts, according to Shemchuk et al. [36], a difference of 2 or more between the pKb (base) and pKa (acid) values may determine salt formation in binary formulations since the probability of a proton transfer is high, and salt formation is expected [20,36].

Figure 2. Arginine and lysine structures.
presents examples of basic amino acids used in binary formulations with acidic APIs. An increase in APIs’ solubility is observed when combined with a basic amino acid co-former, even in the case of a physical mixture. For example, in the physical mixture of indomethacin–arginine, a 3.4-fold increase in the solubility of pure crystalline indomethacin was reported, only 20% below the increase achieved in the co-amorphous mixture.
Although formulations with AA have been studied at equimolar ratios [37,38,39], the molar ratio between the APIs and the co-formers is an essential parameter in a formulation, and Liu et al. [40] determined that equimolar compositions only sometimes maximize solubility since many interactions may exist between components. Different studies have reported that solubility enhancement of folic acid can be maximized at molar ratios of FA: Co-former of 1:2 [4,41].
Because of their acidic nature, basic AAs are suitable co-formers for obtaining a formulation with higher solubility. However, some studies include a combination of arginine with FA as supplements [42,43,44,45,46,47] and histidine as a solubility enhancer if liposome encapsulated FA [2], although the authors do not mention the proportion of folic acid and histidine. To the best of the authors’ knowledge, there are no previous studies of binary systems of FA with basic amino acids formulated to maximize its solubility and to study the effect of its preparation methods on the formulation’s physicochemical properties. This paper aims to explore these binary systems using ARG and LYS as co-formers and to determine the ratio between folic acid and amino acid of the highest solubility through the implementation of a conductimetric titration, which has not been used for this kind of acid–base binary amorphous drug formulation. Moreover, enhancing the solubility and bioavailability of folic acid in combination with other essential nutrients may lead to multicomponent therapeutic and nutritional formulations with expectedly higher solubility, and thus higher bioavailability, than current formulations for preventing and treating chronic diseases during pregnancy.
2. Materials and Methods
The following reagents were acquired and used without any further treatment. Folic acid (FA), (C19H19N7O6, MW = 441.4 g/mol Sigma Aldrich, St. Louis, MO, USA), L-Lysine (LYS) (C6H14N2O2, ≥98%, MW = 146.19 g/mol, Sigma Aldrich, St. Louis, MO, USA Lot. 13CCB3586), L-Arginine (ARG) (C6H14N4O2, ≥98%, MW = 174.20 g/mol, Sigma Aldrich, St. Louis, MO, USA, Lot. 700640615). MiliQ-Water was used as the solvent (18.2 mΩ), Glacial acetic acid (CH3COOH, 100%, MW = 60.05 g/mol, J.T. Baker, Lot. K25C70), Acetonitrile (ACN, HPLC grade MW = 44 g/mol Honeywell, St. Harvey, MI, USA).
2.1. Conductimetric and Potentiometric Titration of Folic Acid with Amino Acid for Composition-Solubility Optimization
Conductometric and potentiometric titrations were conducted to establish the effective molar ratio at which the full acid–base interaction of FA with the AA occurred. Conductivity and pH measurements were carried out while adding 10 μL aliquots of an aqueous solution of AA of a known concentration to 10 mg of crystalline powder FA suspended in 10 mL of deionized water. A Vernier conductivity meter and potentiometer were used, and the data was collected with Logger Pro software version 3.8.4.
2.2. Preparation of Binary Formulations of FA:AA
Three methodologies of preparing the binary formulation of FA:AA were explored with the molar ratio of 1:2.5 found in the conductimetric titration experiments.
The FA:AA ASE binary systems were prepared in a 5 mL beaker weighing a total mass of 100 mg of sample and 1 mL of MiliQ-Water. The solution was stirred for approximately 50 min and covered to prevent light exposure. The solution was dried under a vacuum oven at a temperature of 60 °C. A small sample was collected and analyzed using a Simultaneous Thermal Analyzer STA 6000 (PerkinElmer®, Waltham, MA, USA). 10 mg of the sample were heated from 37 °C to 110 °C at a heating rate of 10 °C/min and held isothermally to record any weight loss for an hour.
The FA:AA BM binary system was prepared, weighing a total mass of 100 mg. The system was amorphized using a Fritsch Pulverisette 7 planetary ball mill. The binary system was placed inside a stainless-steel grinding bowl with six 10 mm stainless steel balls and ground at 850 rpm at 15 min intervals with 10 min rests to prevent degradation of FA through heat until amorphization.
2.3. Structural Characterization by Powder X-ray Diffraction (PXRD)
To evaluate the crystallinity of the samples, structural analysis was performed using an X-ray diffractometer, Miniflex 600, Rigaku (Tokyo, Japan), and a Cu (Kα) cathode as the source. The conditions used in all analyses were a voltage of 40 kV and a current of 15 mA; a 3° to 40° was measured with a step of 0.05° and a speed of 2°/min. Samples were recovered and stored in a desiccator under a vacuum after analysis.
2.4. Intermolecular Interactions by Fourier-Transform Infrared Spectroscopy (FTIR)
To characterize the intermolecular interactions between FA and AA, binary formulations and pure components were analyzed using a Perkin Elmer FTIR equipment, Spectrum 100 model. All spectra were acquired with a resolution of 4 cm−1 in a range from 4000 to 380 cm−1. For the analysis of the spectra, Perkin Elmer spectrum software version 10.6.0 was used.
2.5. Solubility Measurements
The solubility of FA was determined by reversed-phase high-pressure liquid chromatography (HPLC). An Agilent Series 1100 (Agilent Technologies, Santa Clara, CA, USA), equipped with a G1322A degasser, a G1311A quatpump, a G1313A autosampler (ALS) and a G1314A UV-VIS detector, was used. Moreover, 20 µL samples were injected onto a 150 mm × 4.60 mm hypersil gold C18 selectivity 5 µm protected by a pre-column guard cartridge (Thermo Scientific, Rochester, NY, USA).
For the analysis of FA and its salts, a mobile phase composed of 0.1% acetic acid and acetonitrile (ACN) in a ratio of 86:14 previously filtered through a 0.2 µm, 47 mm diameter nylon membrane (Thermo Scientific, Dreieich, Germany), was used. The isocratic flow rate was set at 1.4 mL/min, the column temperature was maintained at 25 °C, and the detection wavelength was 280 nm. The methodology was based on Osseyi et al. [48].
A standard solution of FA was prepared to construct a reliable calibration curve. Given the low solubility of FA in water, ARG was added to create a stock solution at molar ratio FA: ARG of 1:2 and a concentration of 50 ppm. From three stock solutions, dilutions ranging from 0.5 to 50 ppm were prepared with 14 intermediate points. These were used to determine linearity and construct calibration curves. Since FA is light sensitive [49,50], all solutions were stored at 4 °C and protected from light exposure. Each solution was evaluated in triplicate and filtered through a 0.2 µm syringe filter before analysis.
To address the significant differences in solubility between pure FA and binary formulations, two different experimental approaches were employed, both designed to ensure the presence of excess FA. In the first approach, 5 mg of FA binary formulation was taken and mixed in an Eppendorf tube with 20 µL of water. The samples were centrifuged for 3 min at 5000 rpm, then subjected to four iterations of vortex at 3000 rpm for 3 min and centrifugation at 10,000 rpm for 5 min. Once complete dissolution was confirmed, the sample underwent final centrifugation at 10,000 rpm for 5 min to prepare for analysis. The samples underwent consecutive dilutions before injecting 5 μL of the final solution into the HPLC column. The samples underwent consecutive dilutions before injecting 5 μL of the final solution into the HPLC column. In the second approach, 4 mg of pure FA was dissolved in 50 mL of water and stirred for 24 h at room temperature under dark conditions to prevent photodegradation. With the first approach, a theoretical maximum concentration of 125,000 ppm FA would be reached, whereas with the second approach, the concentration would be 80 ppm. Regardless of the approach, all samples were filtered using a 0.2 µm pore size syringe filter and subjected to triplicate analysis by HPLC.
2.6. Thermal Stability of the Formulations by Simultaneous Thermal Analysis
The different FA formulations were analyzed in a Perkin Elmer Simultaneous Thermal Analyzer STA 6000 (PerkinElmer®, Waltham, MA, USA). Measurements were performed in 25 μL ceramic sample pans containing around 10 mg of sample. The samples were heated from 15 °C to 140 °C at a heating rate of 10 °C/min under a nitrogen atmosphere. Before use, the system was purged with nitrogen (19.8 mL/min) for one hour. The instrument was calibrated using metallic Indium, corroborating its melting temperature at 156.6 °C.
2.7. SEM Inspection of the Binary System’s Morphology
To characterize the morphology of the binary systems produced, samples were prepared by casting the powders of the physical mixture of LYS and ARG with FA and the systems prepared by solvent evaporation (ASE) and ball milling (BM) on a carbon adhesive tape attached to an aluminum sample holder. The samples were inspected in a Phenom Pro X scanning electron microscope operated at 5 kV with a backscattering detector.
3. Results
3.1. Conductimetric and Potentiometric Titrations
In this experiment, the acid–base reaction between FA and lysine (LYS) and arginine (ARG) was monitored during a potentiometric titration, where an increase in the pH followed the addition of the amino acid, expressed as molar ratio, as shown in Figure 3a,b. The FA:AA system acts as a buffer in the 4.5–6.0 pH region. Several studies have reported that the solubility of folic acid is pH-dependent [8,51,52]. Additionally, the second derivate demonstrates (red dashed lines in Figure 3a,b) the change of slope around the equivalent molar ratio of FA:AA of 1:2 for both amino acids.
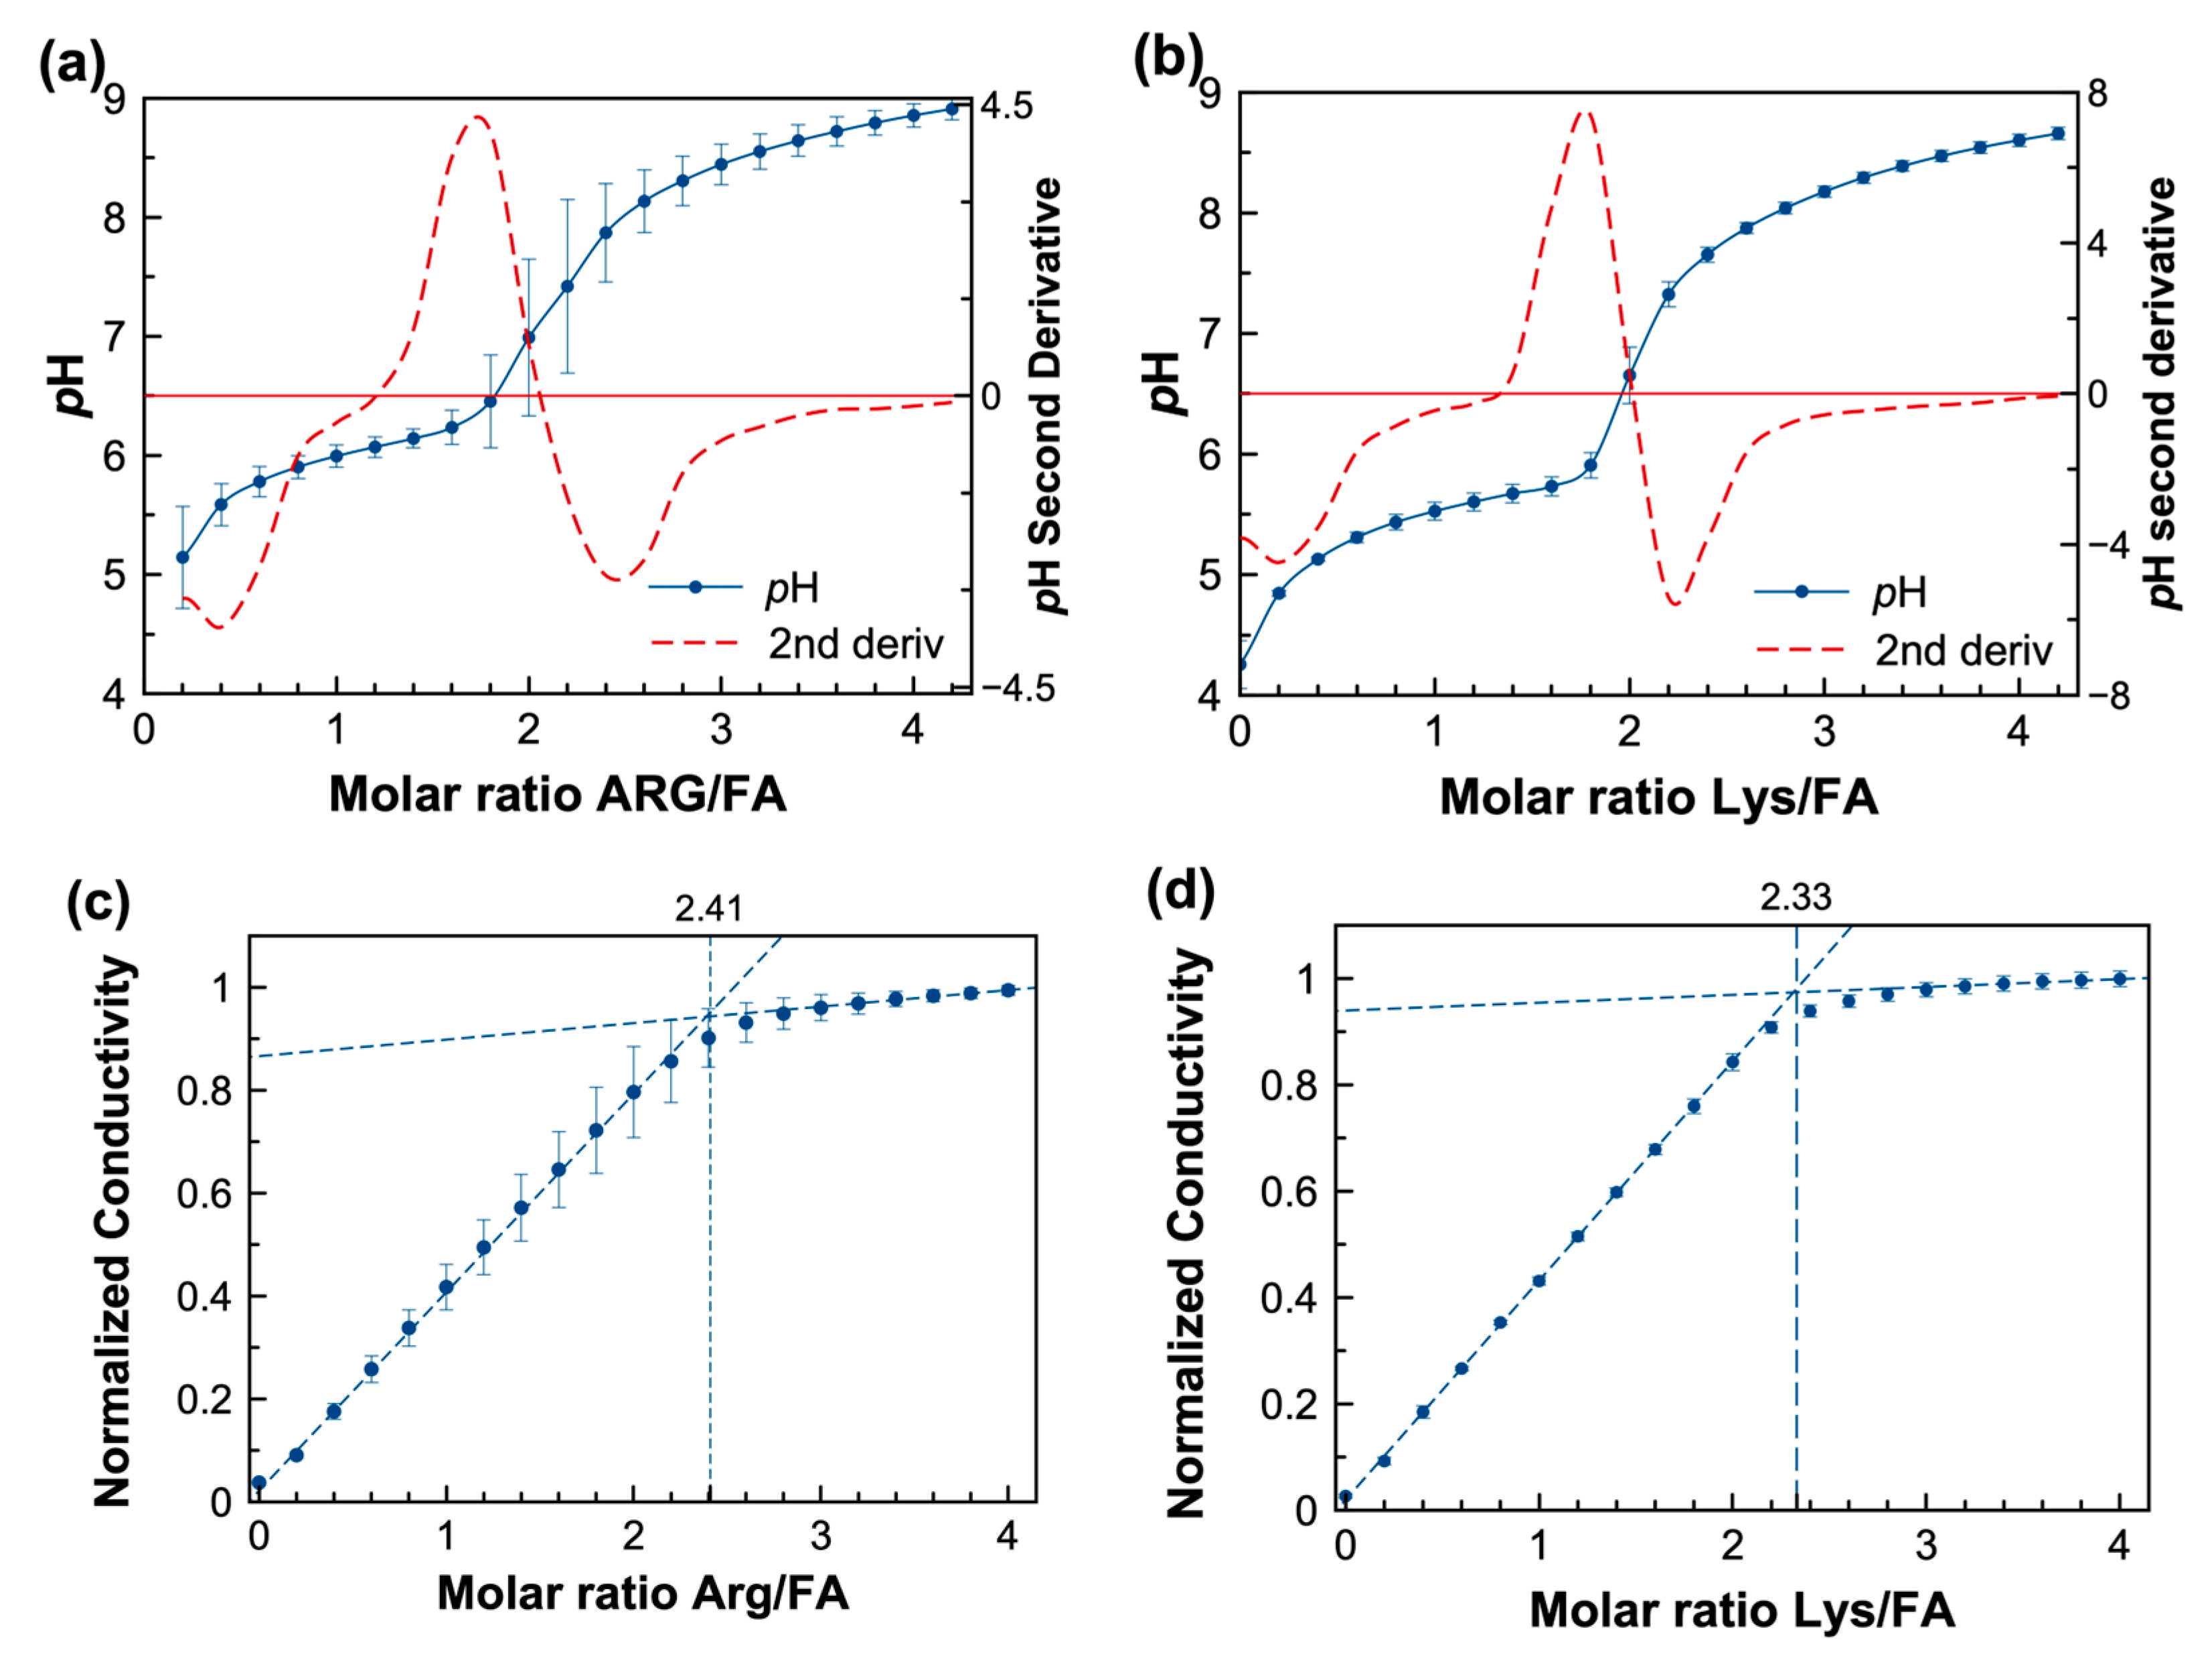
Figure 3. (a,b) potentiometric titration of FA with lysine (Lys) and arginine (Arg) and numerical second derivative of pH (red dashed line), respectively (c,d) conductimetric titration of FA with a concentrated solution of ARG and LYS, respectively; the extrapolation dashed lines cross at the molar ratio of maximum conductivity.
Conductivity was measured in similar titrations since it represents a convenient tool for studying systems in which ionic species are produced due to the acid–base reaction between FA and basic amino acids such as LYS or ARG [53]. In the conductimetric titration curves (Figure 3c,d), the conductivity increased linearly when LYS or ARG were added to the FA. Then, maximum ionization occurs when the conductivity no longer increases, as shown by the intersecting slopes. When extrapolating both regions of the conductivity, a crossover occurs at an FA:AA molar ratio of 1:2.33 for FA:LYS and 1:2.41 for FA/ARG, respectively. Macfie et al. refer to this intercept as the conductivity point corresponding to a saturated solution [54]. The conductimetric titrations suggest that a maximum solubility for the FA:AA systems is reached at a molar ratio of approximately 1:2.5. Thus, the solubility enhancement achieved at this molar ratio was explored for both systems.
3.2. Structural Characterization by X-ray Diffraction (XRD)
Figure 4 compares the diffraction patterns for the different FA formulations. It can be noticed that the diffraction pattern for the simple physical mixture (CPM) is equivalent to the sum of signals of each pure component. For the FA:AA-ASE formulation, a broad halo, characteristic of amorphous materials, is observed, except for a peak at 27° for both lysine and arginine (Figure 4). In the case of the ball milling formulations FA:ARG-BM, a complete amorphization was achieved after eight ball milling cycles of 15 min, while the formulation FA:LYS-BM was only amorphized after 14 cycles of 15 min but showed a broad peak at 27°, as observed in the systems prepared by solvent evaporation (ASE). The presence of this diffraction peak was previously observed, and it is interpreted, according to Magri et al., as a result of the self-assembly of dianionic folate ions through hydrogen bonds and π−π stacking [55].
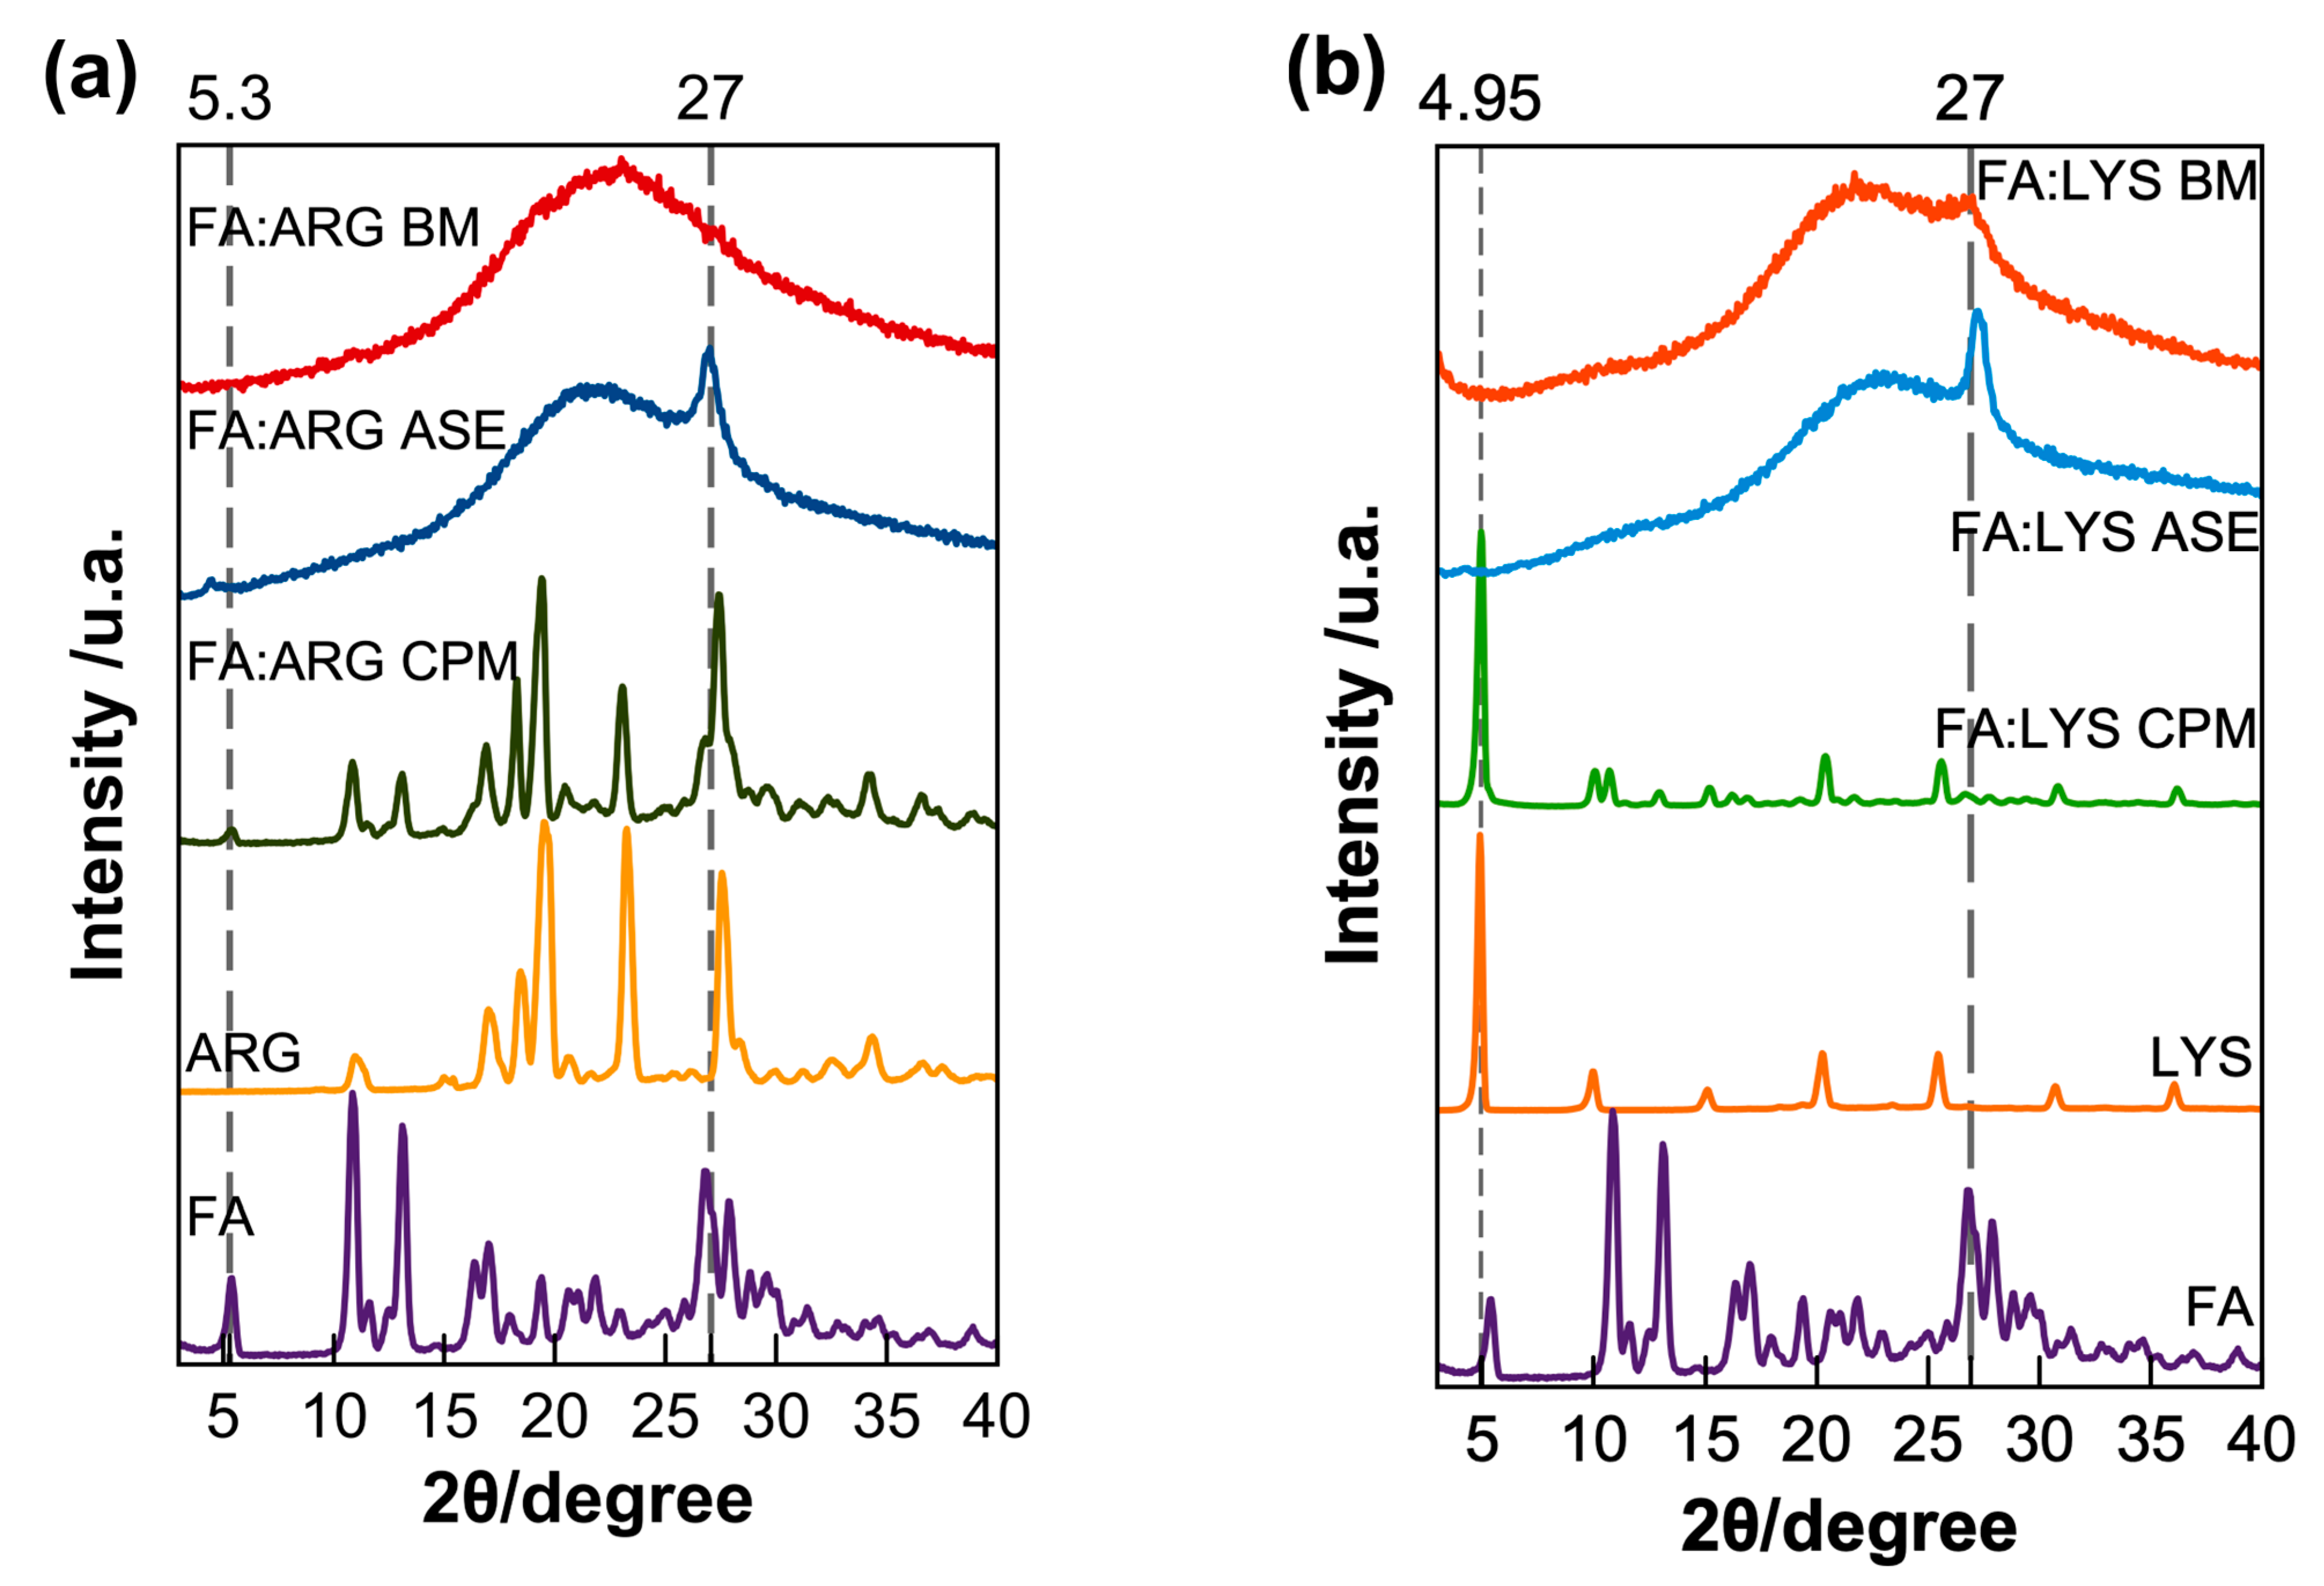
Figure 4. X-ray diffraction of pure components and formulations of (a) arginine and (b) lysine pure components along with the physical mixtures (CPM), amorphous by solvent evaporation (ASE), and the ball milled (BM). For comparative purposes, each diffraction pattern is normalized with respect to its maximum intensity.
3.3. Intermolecular Interactions Results
The IR spectra of pure components and all binary samples were acquired to evaluate the presence of molecular interactions due to the formation of salts. In the case of pure FA, the band at 1696 cm−1 is attributed to the stretching vibration of the C=O of carboxylic acid and, at 1604 cm−1, is related to the bending of the N-H group. Moreover, in 1680 cm−1, the band is associated with the phenyl ring; finally, the peak in 1409 cm−1 is associated with the deformation of the O-H bond in the phenyl skeleton and, in 2928 cm−1, is attributed to the C-H bond [56]. According to Kasten et al., the antisymmetric stretch of the corresponding ionized carboxyl group is found between 1505 and 1610 cm−1 [23]. For example, the study of Magri et al. details how the formation of sodium folate salts affects the structure of the molecule and, consequently, its vibrational spectrum, especially the signals associated with the carboxyl groups, which are displaced towards lower energy ranges in the spectra of folate salts compared to folic acid, suggesting intermolecular hydrogen bonding and weakening of the C=O bond. Furthermore, some bands present in the spectra of folic acid are absent in those of folate salts, indicating deprotonation of the glutamic acid moiety and formation of an enolate group. This absence of bands and the displacement observed in others are key evidence for the formation of folate salts [55]. Thus, this spectral region was selected for analysis.
In addition to pure folic acid, Figure 5 also shows the spectra of the FA-LYS and FA-ARG formulations. In both formulations, under the two types of preparation, the signals’ broadening is evident, reflecting the amorphization of the samples. Following the study by Magri et al. [55], the movement or absence of carboxyl group signals was analyzed, which could be interpreted as deprotonation and possible formation of a salt. When comparing the signals of 1686 cm−1 of the carboxyl of pure folic acid with the FA:AA formulations, we can observe that there is a decrease in signal intensity, and, in some cases, these signals are absent. These changes could be interpreted as the possible formation of a salt in both cases.
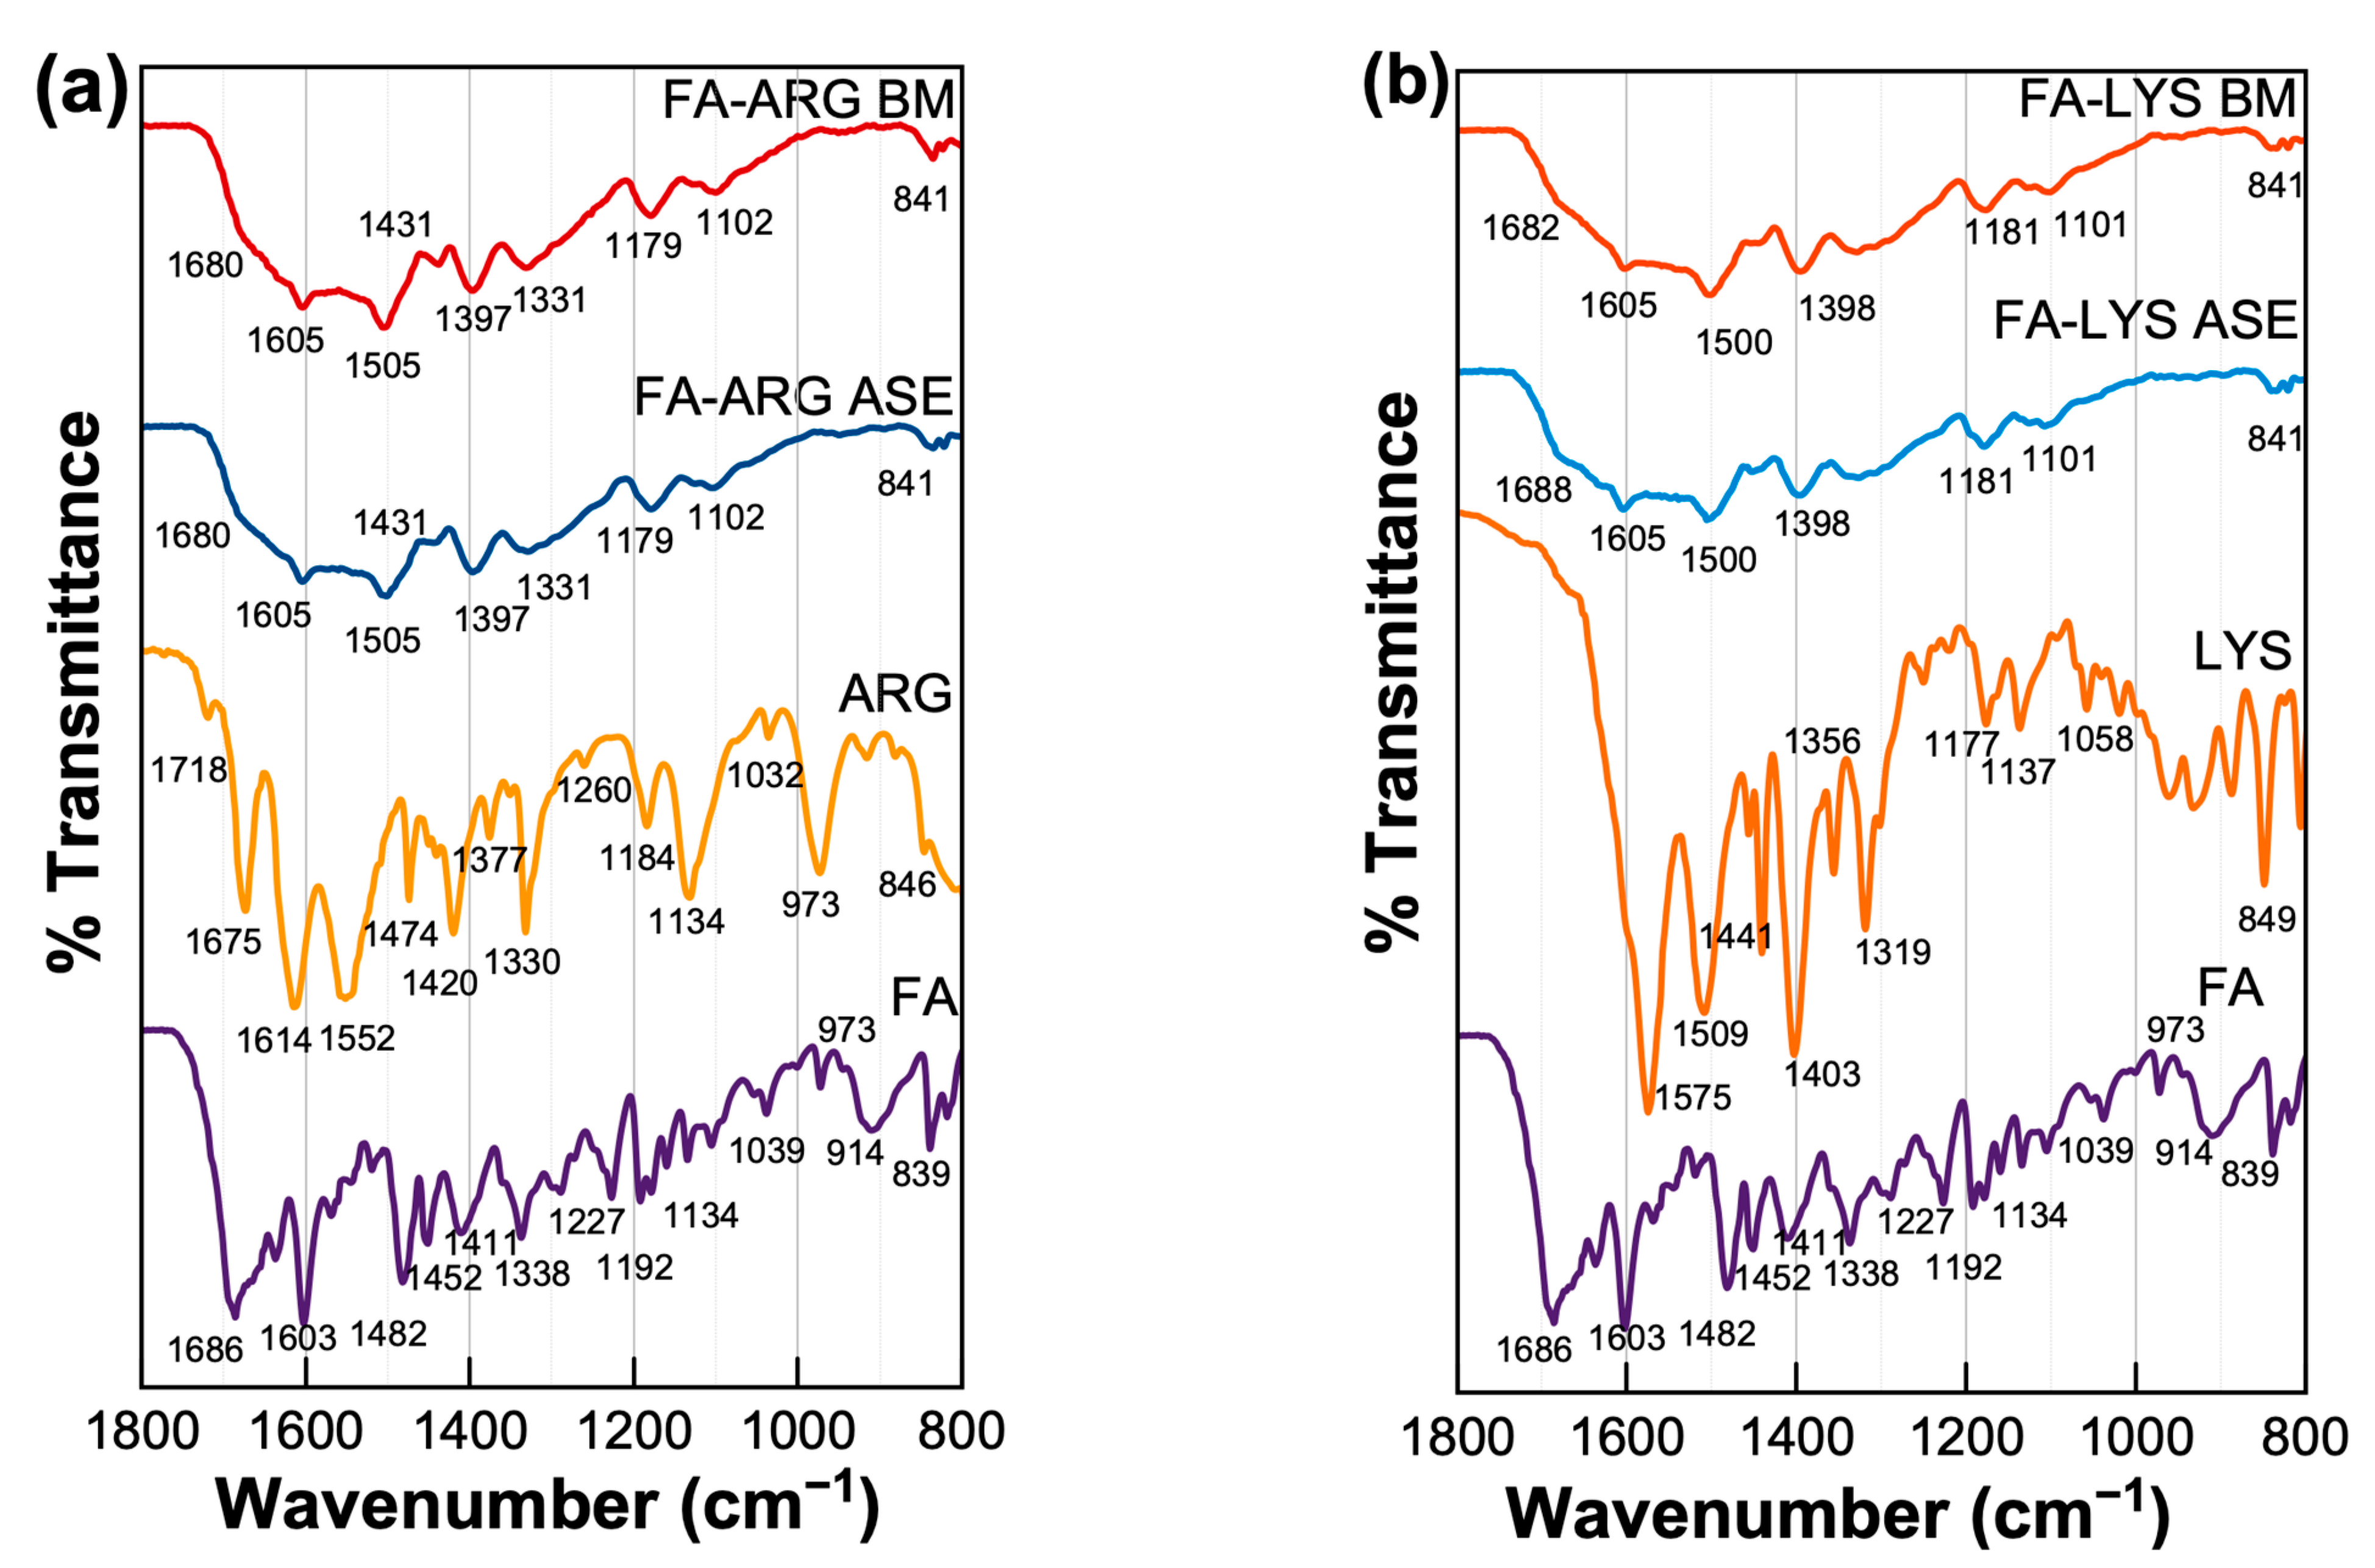
Figure 5. Infrared spectra of different FA formulations and pure components, (a) the FA:LYS systems and (b) the FA: ARG systems, are shown and obtained with Perkin Elmer spectrometer model Spectrum 100.
3.4. Solubility Results
Figure 6 shows the solubility of FA and the different formulations at the molar relation of FA:AA of 1:2.5. FA solubility was found to be 16.15 mg/L, closely related to the value reported in the literature of approximately 10 mg/L [14,57]. The addition of ARG and LYS remarkably improves FA’s solubility at least 6000 times, regardless of the preparation method, which could be attributed to the formation of folate salts, resulting in greater solubility performance due to electrostatic acid–base interactions present [23,58].
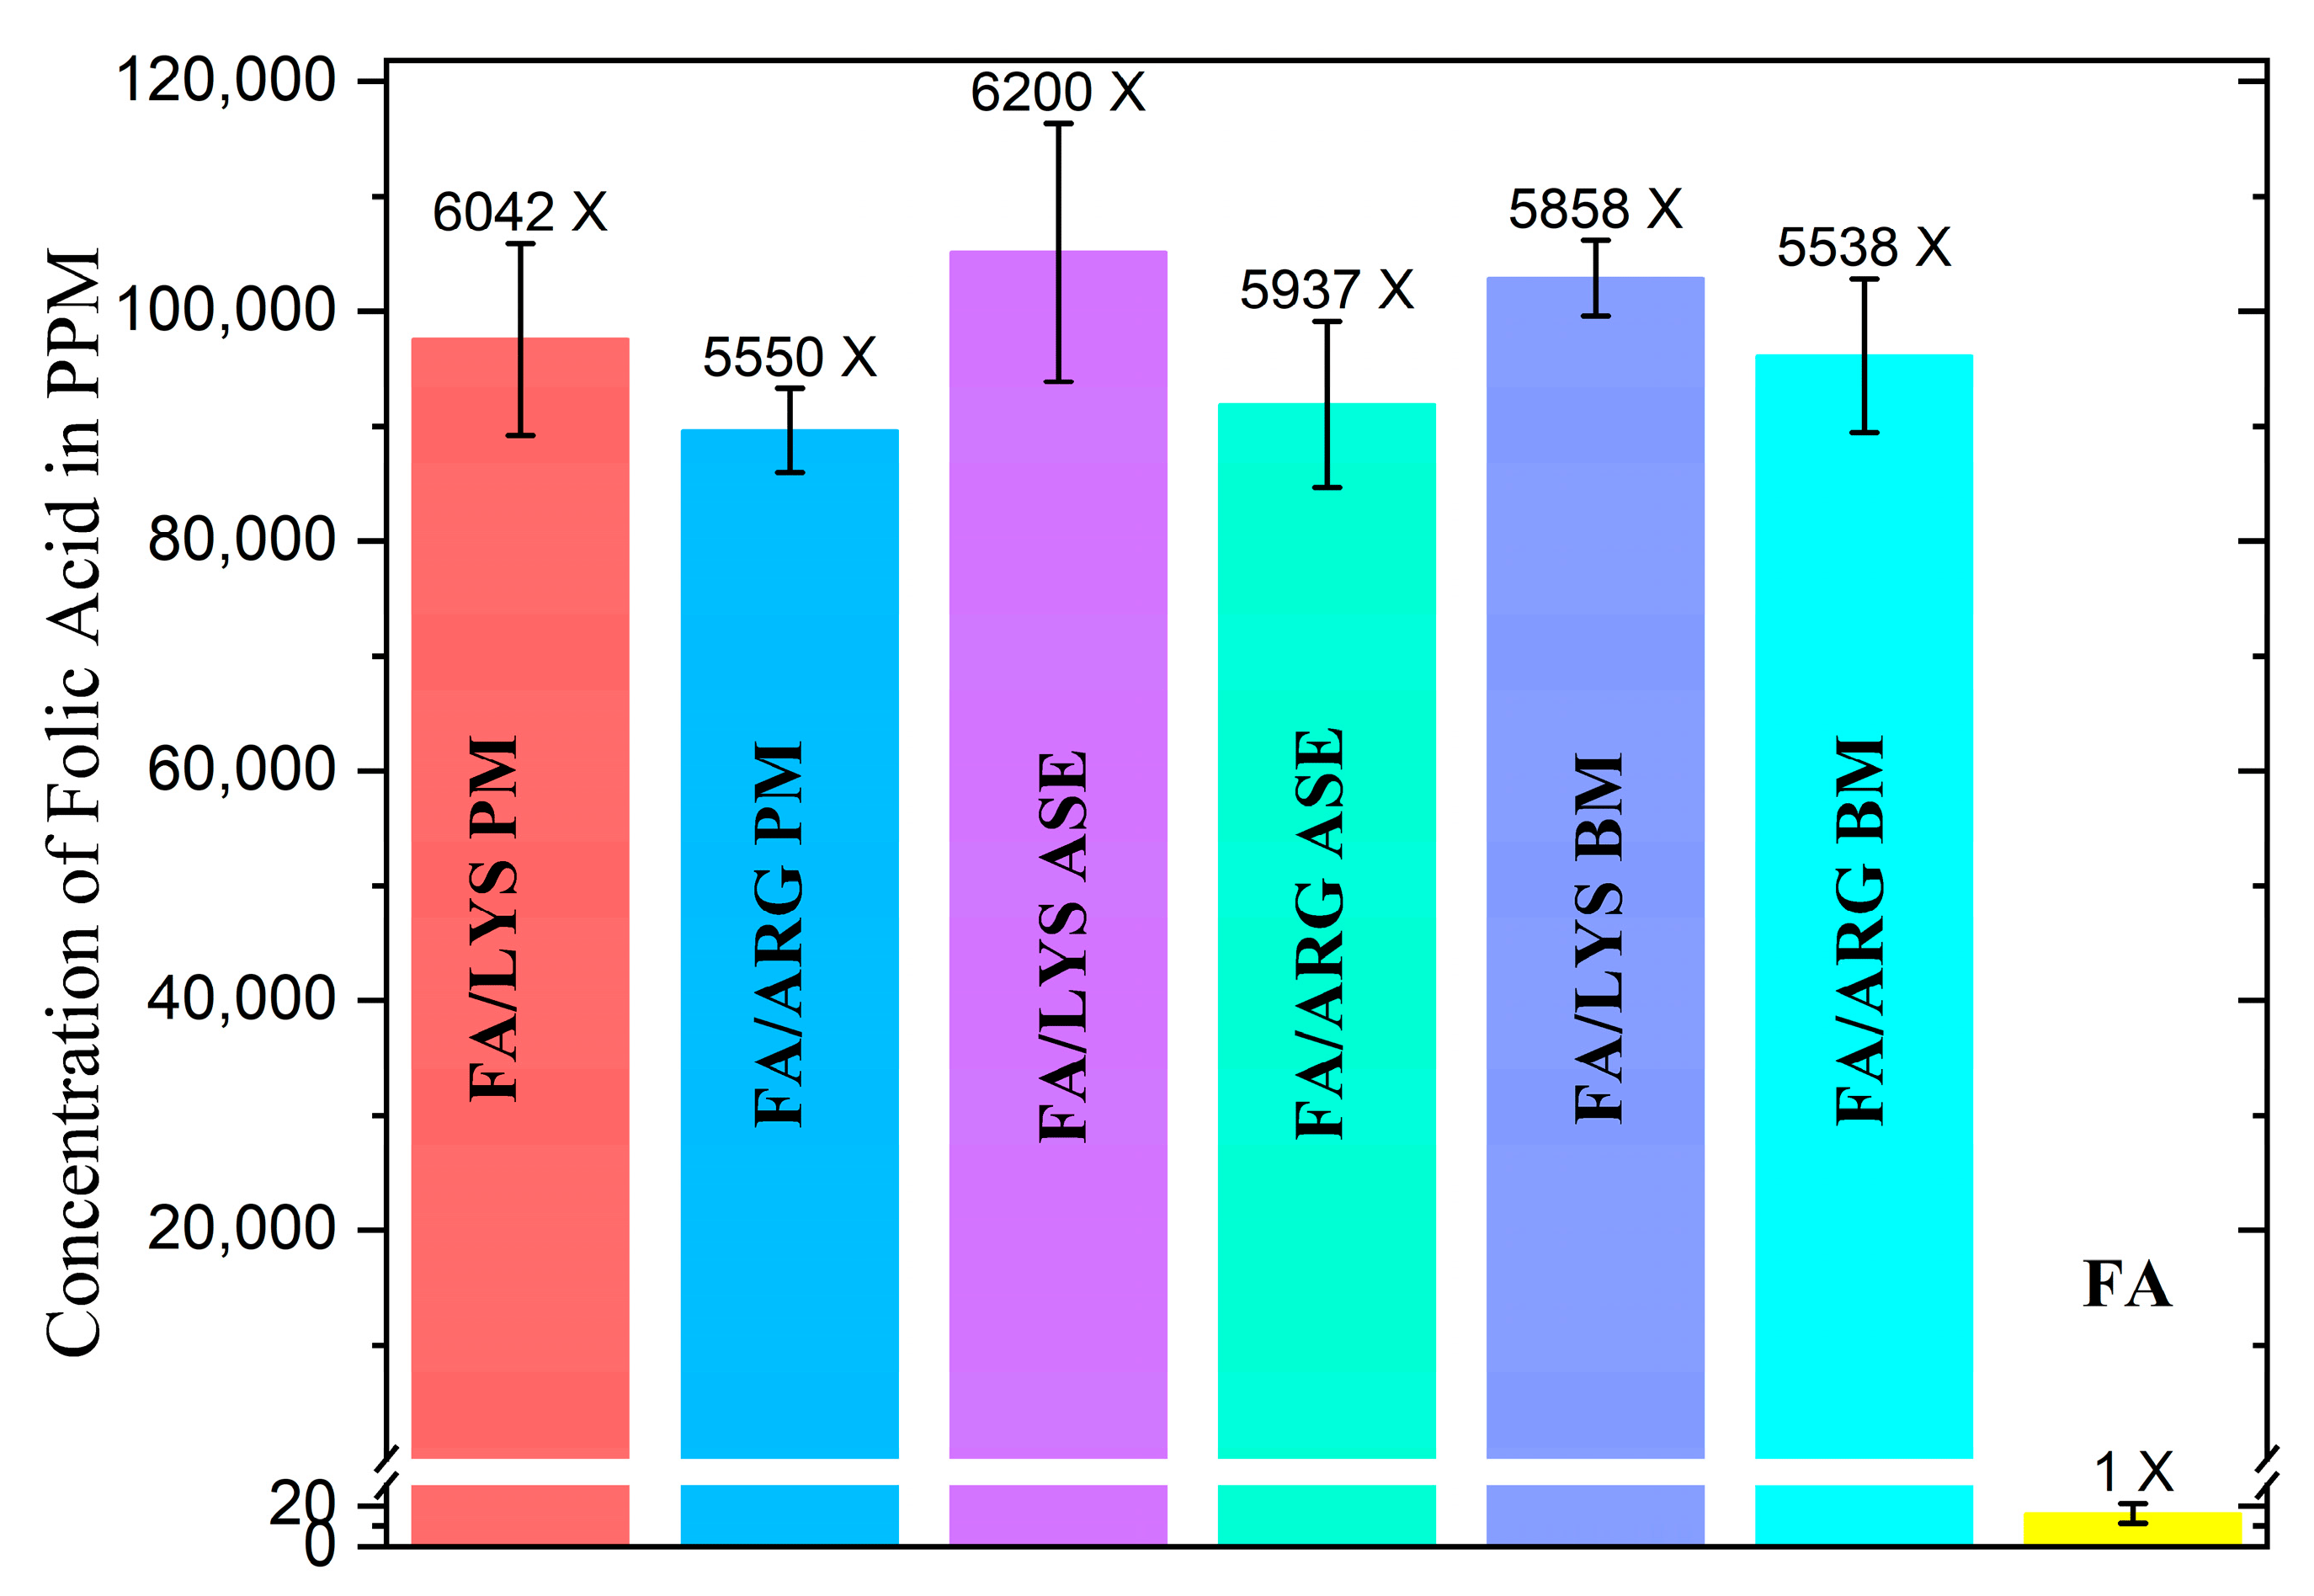
Figure 6. Comparison of solubilities in water of different formulations, with error bars (n = 3), the increment of solubility in comparison with FA alone is above bars. A one-way ANOVA analysis demonstrated that the difference between all media of all FA formulations was not significant with a p-value of 0.014; no matter the different changes in their crystal structure, the solubility of FA has proven not to change significantly. This could be attributed to other unseen root causes.
3.5. Thermal Properties of the FA Formulations
The thermal properties of the FA formulations were evaluated from 20 °C to 150 °C at a 10 °C/min heating rate, using simultaneous thermal analysis, i.e., differential thermal analysis (DTA) and thermogravimetric analysis (TG). The DTA thermograms for the ASE and BM systems are shown in Figure 7. FA-LYS ASE and FA-ARG ASE prepared by solvent evaporation present distinct glass transition steps with onsets at 51 °C and 58 °C, respectively, confirming their amorphous structure. On the other hand, the thermograms corresponding to the ball-milled formulations show a broad peak that extends from 50 °C to 75 °C. No crystallization processes are observed after the glass transition when heating up to 150 °C.

Figure 7. Thermograms for the FA formulations. The solvent evaporation formulations produce amorphous materials with defined onset glass transitions: 51 °C for FA-LYS ASE and 58 °C for the FA-ARG ASE. In the case of the ball-milled formulations, FA-LYS BM and FA-ARG BM, no clear onset can be determined.
3.6. Morphological Inspection of the FA-AA Systems
The morphology of the powders obtained from the different formulations was inspected under electron microscopy and shown in Figure 8. The physical mixtures of the crystalline FA and Lys (Figure 8a) and FA and Arg (Figure 8b) produce aggregates of particles of the order of 1 um. In the case of the binary systems obtained from solvent evaporation, both for FA-Lys (Figure 8c) and FA-Arg (Figure 8d), compact particles of the order of tens of micrometers are observed whose surfaces present typical fracture patterns of amorphous materials, consistent with the X-ray diffraction results, confirming that the binary systems amorphized as a result of the drying process. A similar morphology of amorphous particles is observed in the case of the binary systems obtained by ball milling, although in this case, the particle size is of the order or smaller than 10 um FA-Lys (Figure 8e) and FA-Arg (Figure 8f).
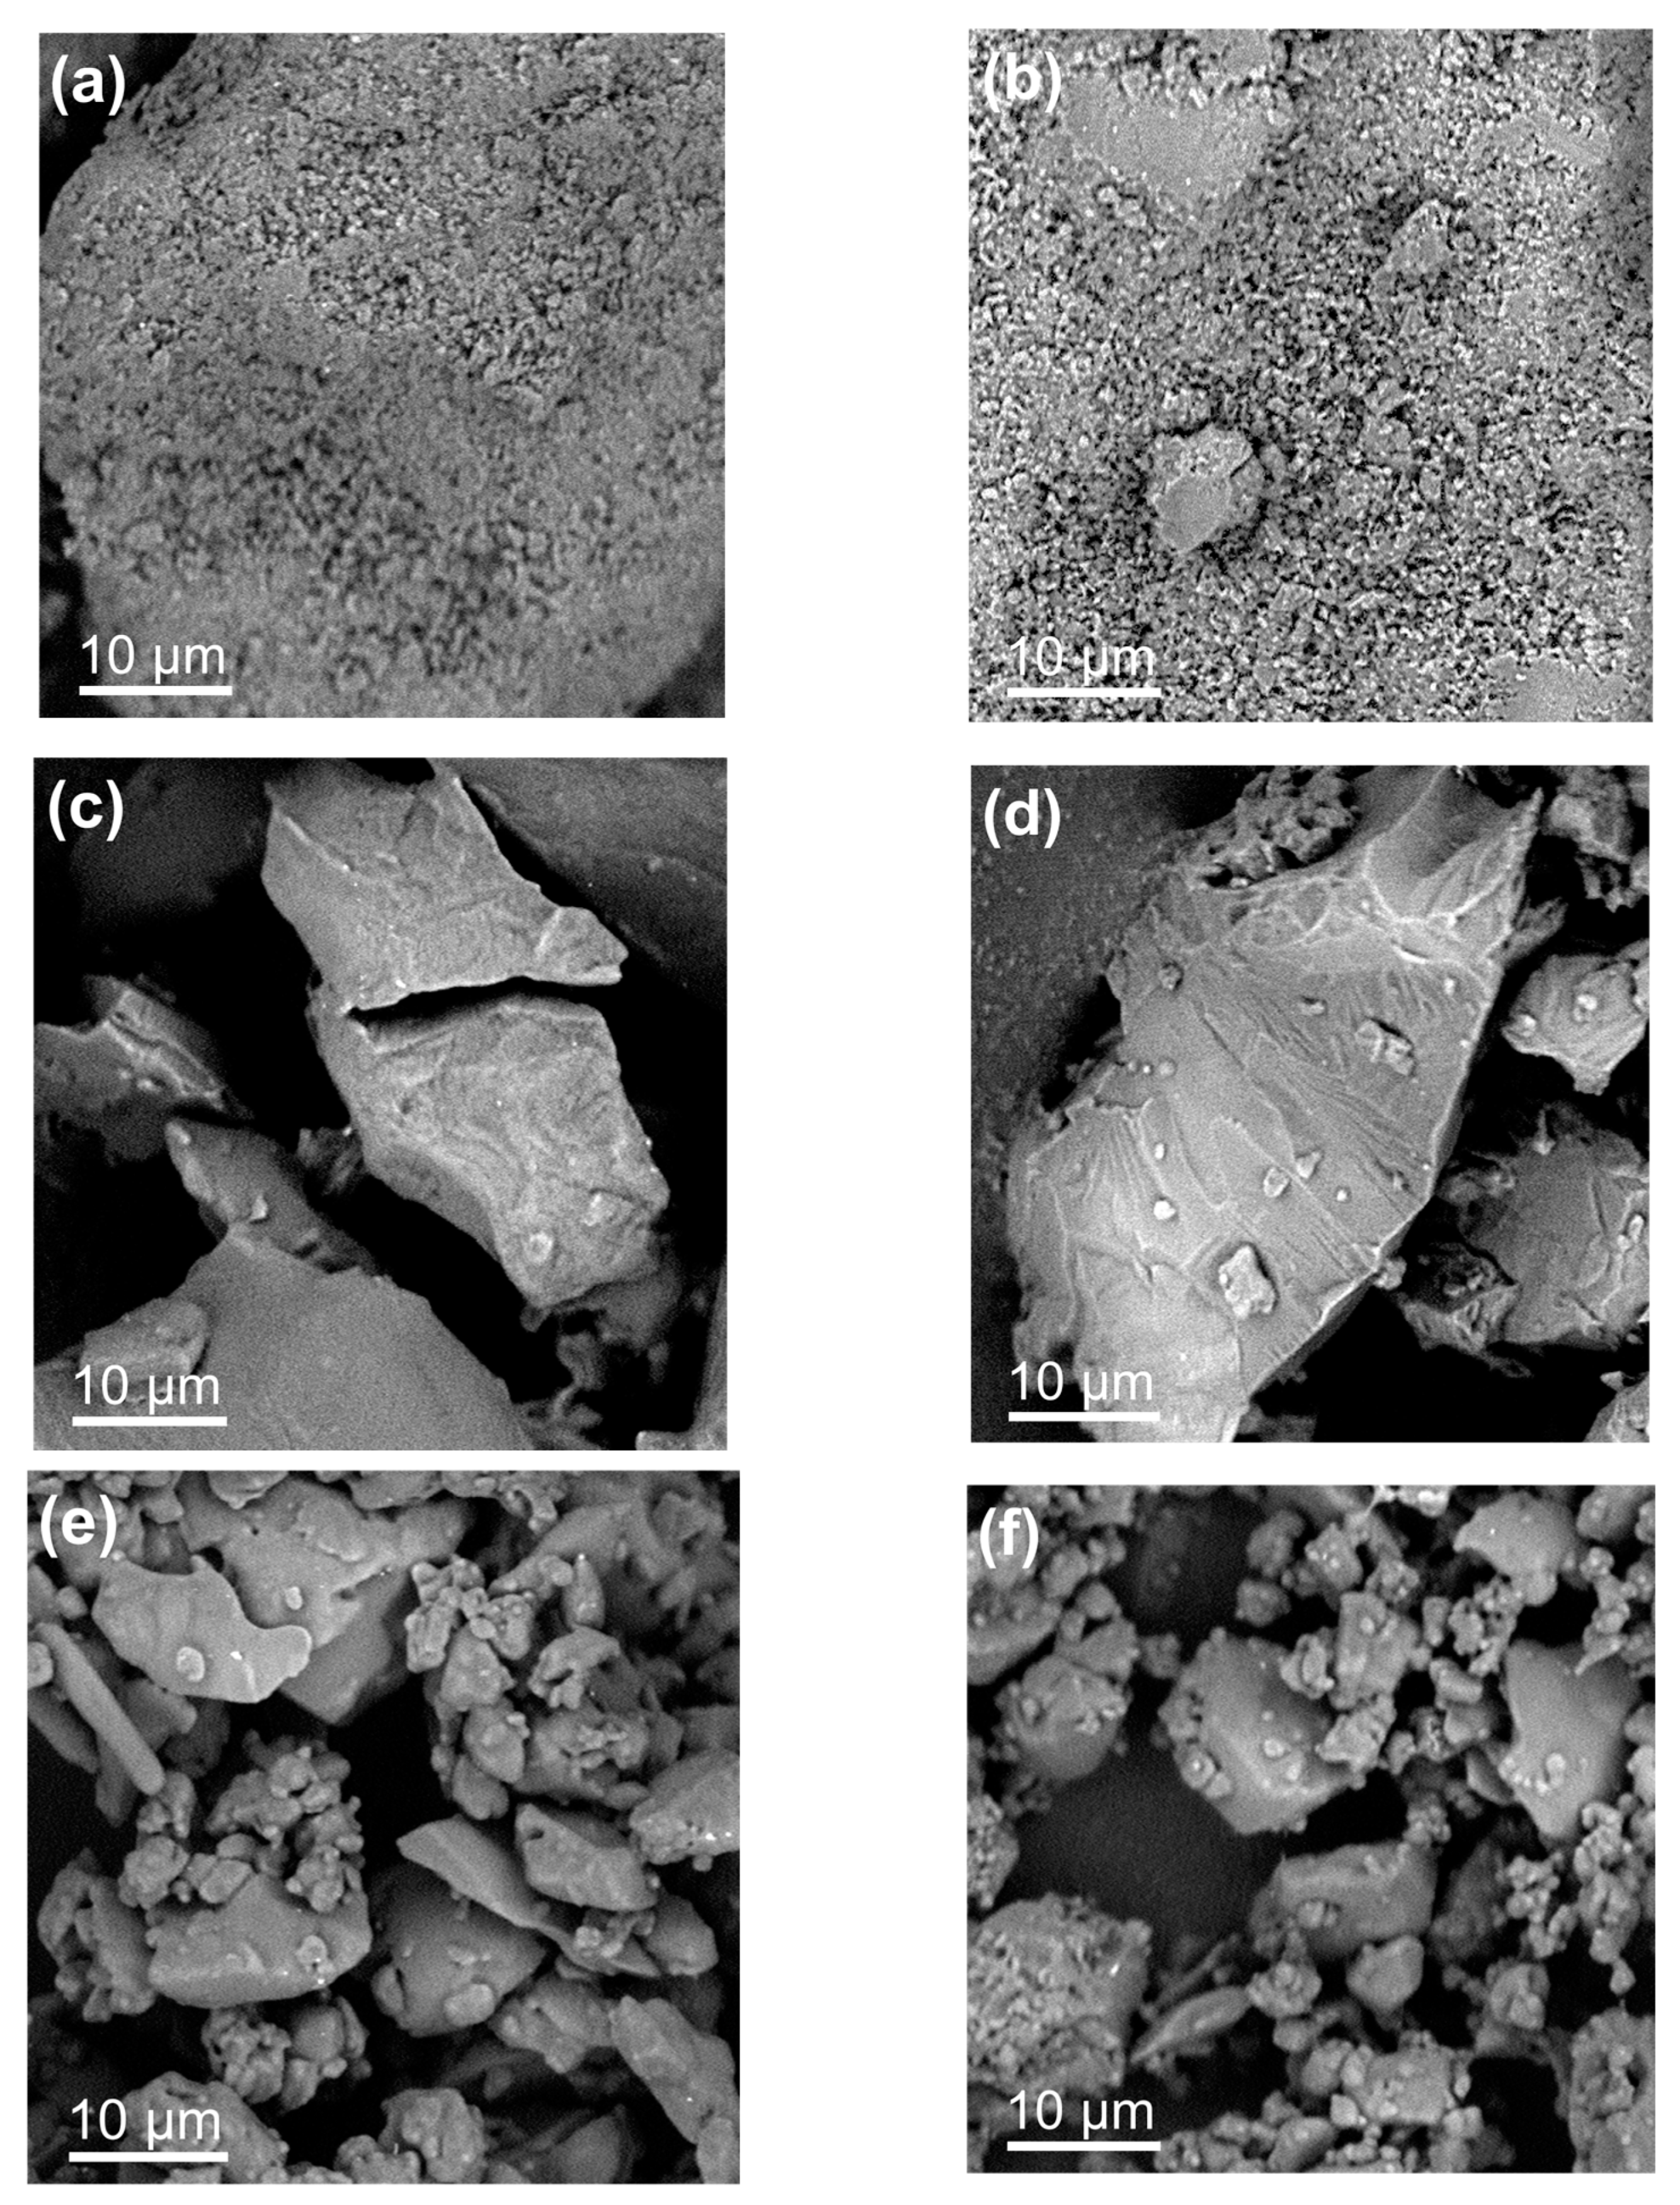
Figure 8. SEM images of the crystalline physical mixture (CPM) of (a) FA-LYS and (b) FA-ARG, amorphous salt by solvent evaporation (AES), (c) FA-LYS and (d) FA-ARG, and amorphous by ball milling (BM) (e) FA-LYS and (f) FA-ARG.
4. Conclusions
The present study implemented a conductimetric titration method to determine the FA:AA molar ratio that maximizes folic acid’s solubility. Finding the optimal required amount of the amino acids prevents administration in an excess dose that could otherwise be disadvantageous. Although conductimetric titration is well known for monitoring acid–base reactions, to our knowledge, the method has not been used to measure the acid–base interaction between folic acid and a basic solubility enhancer. The technique allows the measurement of soluble charge-carrying species, which directly correlates to the solubility of the folic acid. Thus, the conductimetric technique allows for determining the composition of the highest solubility of folic acid with an amino acid, which does not necessarily coincide with a stoichiometric ratio. As a result, it was found that this molar ratio was close to 1:2.5, leading to an increase in FA solubility of at least 6000 times for both basic amino acids ARG and LYS compared to pure FA, regardless of the formulation method. These amino acids were proved to be good co-formers for amorphous folate salt formation with glass transitions well above room temperature. Amorphization through ball milling produced smaller particles than those obtained from solvent evaporation. This work contributes an effective means of administering a highly soluble folic acid formulation.
References
- Naninck, E.F.G.; Stijger, P.C.; Brouwer-Brolsma, E.M. The Importance of Maternal Folate Status for Brain Development and Function of Offspring. Adv. Nutr. 2019, 10, 502–519. [Google Scholar] [CrossRef]
- Batinić, P.M.; Đorđević, V.B.; Stevanović, S.I.; Balanč, B.D.; Marković, S.B.; Luković, N.D.; Mijin, D.Ž.; Bugarski, B.M. Formulation and Characterization of Novel Liposomes Containing Histidine for Encapsulation of a Poorly Soluble Vitamin. J. Drug Deliv. Sci. Technol. 2020, 59, 101920. [Google Scholar] [CrossRef]
- Higdon, J. (Instituto L.P. Folato | Linus Pauling Institute | Oregon State University). Available online: https://lpi.oregonstate.edu/es/mic/vitaminas/folato#determinacion-IDR (accessed on 19 April 2022).
- Braga, D.; Chelazzi, L.; Grepioni, F.; Maschio, L.; Nanna, S.; Taddei, P. Folic Acid in the Solid State: A Synergistic Computational, Spectroscopic, and Structural Approach. Cryst. Growth Des. 2016, 16, 2218–2224. [Google Scholar] [CrossRef]
- Lionaki, E.; Ploumi, C.; Tavernarakis, N. One-Carbon Metabolism: Pulling the Strings behind Aging and Neurodegeneration. Cells 2022, 11, 214. [Google Scholar] [CrossRef]
- Virdi, S.; Jadavji, N.M. The Impact of Maternal Folates on Brain Development and Function after Birth. Metabolites 2022, 12, 876. [Google Scholar] [CrossRef]
- Wu, S.; Feng, P.; Li, W.; Zhuo, S.; Lu, W.; Chen, P.; Sui, Y.; Fang, S.; Yang, Z.; Ye, Y. Dietary Folate, Vitamin B6, and Vitamin B12 and Risk of Cardiovascular Diseases among Individuals with Type 2 Diabetes: A Case-Control Study. Ann. Nutr. Metab. 2023, 79, 5–15. [Google Scholar] [CrossRef] [PubMed]
- Hofsäss, M.A.; de Souza, J.; Silva-Barcellos, N.M.; Bellavinha, K.R.; Abrahamsson, B.; Cristofoletti, R.; Groot, D.W.; Parr, A.; Langguth, P.; Polli, J.E.; et al. Biowaiver Monographs for Immediate-Release Solid Oral Dosage Forms: Folic Acid. J. Pharm. Sci. 2017, 106, 3421–3430. [Google Scholar] [CrossRef]
- Instituto Mexicano del Seguro Social Guía de Práctica Clínica. Control Prenatal Con Atención Centrada En La Paciente. In Guía de Evidencias y Recomendaciones; Instituto Mexicano del Seguro Social (IMSS): Torreón, México, 2017; Volume 104. Available online: https://www.imss.gob.mx/sites/all/statics/guiasclinicas/028GER.pdf (accessed on 11 June 2022).
- Folate and Folic Acid on the Nutrition and Supplement Facts Labels | FDA. Available online: https://www.fda.gov/food/new-nutrition-facts-label/folate-and-folic-acid-nutrition-and-supplement-facts-labels (accessed on 11 June 2022).
- Brito, A.; HertrAmpf, E.; OlivAres, M.; GAitán, D.; SáncHez, H.; Allen, L.H.; Uauy, R. Folatos y Vitamina B12 En La Salud Humana. Rev. Med. Chile 2012, 140, 1464–1475. [Google Scholar] [CrossRef] [PubMed]
- Czeizel, A.E.; Dudás, I.; Vereczkey, A.; Bánhidy, F. Folate Deficiency and Folic Acid Supplementation: The Prevention of Neural-Tube Defects and Congenital Heart Defects. Nutrients 2013, 5, 4760–4775. [Google Scholar] [CrossRef]
- Verwei, M.; Van Den Berg, H.; Havenaar, R.; Groten, J.P. Effect of Folate-Binding Protein on Intestinal Transport of Folic Acid and 5-Methyltetrahydrofolate across Caco-2 Cells. Eur. J. Nutr. 2005, 44, 242–249. [Google Scholar] [CrossRef]
- O’Neil, M.J. The Merck Index: An Encyclopedia of Chemicals, Drugs, and Biologicals, 14th ed.; Merck and Co., Inc.: Whitehouse Station, NJ, USA, 2001. [Google Scholar]
- Fogacci, S.; Fogacci, F.; Cicero, A.F.G. Nutraceuticals and Hypertensive Disorders in Pregnancy: The Available Clinical Evidence. Nutrients 2020, 12, 378. [Google Scholar] [CrossRef] [PubMed]
- Savjani, K.T.; Gajjar, A.K.; Savjani, J.K. Drug Solubility: Importance and Enhancement Techniques. ISRN Pharm. 2012, 2012, 195727. [Google Scholar] [CrossRef] [PubMed]
- Younis, I.R.; Stamatakis, M.K.; Callery, P.S.; Meyer-Stout, P.J. Influence of PH on the Dissolution of Folic Acid Supplements. Int. J. Pharm. 2009, 367, 97–102. [Google Scholar] [CrossRef] [PubMed]
- Giebe, K.; Counts, C.; O’Shea, C. Comparison of Prenate Advance(TM) with Other Prescription Prenatal Vitamins: A Folic Acid Dissolution Study. Adv. Ther. 2000, 17, 179–183. [Google Scholar] [CrossRef]
- Cerreia Vioglio, P.; Chierotti, M.R.; Gobetto, R. Pharmaceutical Aspects of Salt and Cocrystal Forms of APIs and Characterization Challenges. Adv. Drug Deliv. Rev. 2017, 117, 86–110. [Google Scholar] [CrossRef]
- Elder, D.P.; Holm, R.; De Diego, H.L. Use of Pharmaceutical Salts and Cocrystals to Address the Issue of Poor Solubility. Int. J. Pharm. 2013, 453, 88–100. [Google Scholar] [CrossRef]
- Guillory, J.K. Journal of Medicinal Chemistry; American Chemical Society (ACS): Washington, DC, USA, 2003; Volume 46. [Google Scholar]
- Sarma, B.; Chen, J.; Hsi, H.Y.; Myerson, A.S. Solid Forms of Pharmaceuticals: Polymorphs, Salts and Cocrystals. Korean J. Chem. Eng. 2011, 28, 315–322. [Google Scholar] [CrossRef]
- Kasten, G.; Lobo, L.; Dengale, S.; Grohganz, H.; Rades, T.; Löbmann, K. In Vitro and in Vivo Comparison between Crystalline and Co-Amorphous Salts of Naproxen-Arginine. Eur. J. Pharm. Biopharm. 2018, 132, 192–199. [Google Scholar] [CrossRef]
- Babu, N.J.; Nangia, A. Solubility Advantage of Amorphous Drugs and Pharmaceutical Cocrystals. Cryst. Growth Des. 2011, 11, 2662–2679. [Google Scholar] [CrossRef]
- Morales, P.E.; Cruz, J.; Martinez, C.; Videa, M.; Martinez, L.M.; Eugenia Morales, P.; Cruz, J.; Martínez, C.; Videa, M.; María Martínez, L. Nano and Micro Dispersions of Two-Phase Amorphous-Amorphous Drug Formulations as Strategy to Enhance Solubility of Pharmaceuticals. Mater. Today Proc. 2019, 13, 390–396. [Google Scholar] [CrossRef]
- Shi, Q.; Moinuddin, S.M.; Cai, T. Advances in Coamorphous Drug Delivery Systems. Acta Pharm. Sin. B 2019, 9, 19–35. [Google Scholar] [CrossRef] [PubMed]
- Dengale, S.J.; Grohganz, H.; Rades, T.; Löbmann, K. Recent Advances in Co-Amorphous Drug Formulations. Adv. Drug Deliv. Rev. 2016, 100, 116–125. [Google Scholar] [CrossRef]
- Chavan, R.B.; Thipparaboina, R.; Kumar, D.; Shastri, N.R. Co Amorphous Systems: A Product Development Perspective. Int. J. Pharm. 2016, 515, 403–415. [Google Scholar] [CrossRef] [PubMed]
- Yu, L. Amorphous Pharmaceutical Solids: Preparation, Characterization and Stabilization. Adv. Drug Deliv. Rev. 2001, 48, 27–42. [Google Scholar] [CrossRef] [PubMed]
- Wu, W.; Grohganz, H.; Rades, T.; Löbmann, K. Comparison of Co-Former Performance in Co-Amorphous Formulations: Single Amino Acids, Amino Acid Physical Mixtures, Amino Acid Salts and Dipeptides as Co-Formers. Eur. J. Pharm. Sci. 2021, 156, 105582. [Google Scholar] [CrossRef]
- Martínez-Jiménez, C.; Angeles, J.; Videa, M.; Martinez, L.M.; Cruz-Angeles, J.; Videa, M.; Martínez, L.M. Co-Amorphous Simvastatin-Nifedipine with Enhanced Solubility for Possible Use in Combination Therapy of Hypertension and Hypercholesterolemia. Molecules 2018, 23, 2161. [Google Scholar] [CrossRef]
- Cruz-Angeles, J.; Videa, M.; Martínez, L.M.; Angeles, J.; Videa, M.; Martinez, L.M. Highly Soluble Glimepiride and Irbesartan Co-Amorphous Formulation with Potential Application in Combination Therapy. AAPS PharmSciTech 2019, 20, 144. [Google Scholar] [CrossRef]
- Anuruddha, C.; Jagdale, S.C.; Preeti, G. Amino Acid Conjugation: An Approach to Enhance Aqueous Solubility and Permeability of Poorly Water Soluble Drug Ritonavir. JDDT 2019, 9, 252–256. [Google Scholar]
- Kasten, G.; Grohganz, H.; Rades, T.; Löbmann, K. Development of a Screening Method for Co-Amorphous Formulations of Drugs and Amino Acids. Eur. J. Pharm. Sci. 2016, 95, 28–35. [Google Scholar] [CrossRef]
- Wu, W.; Löbmann, K.; Schnitzkewitz, J.; Knuhtsen, A.; Pedersen, D.S.; Rades, T.; Grohganz, H. Dipeptides as Co-Formers in Co-Amorphous Systems. Eur. J. Pharm. Biopharm. 2019, 134, 68–76. [Google Scholar] [CrossRef]
- Shemchuk, O.; André, V.; Duarte, M.T.; Taddei, P.; Rubini, K.; Braga, D.; Grepioni, F. Molecular Salts of l -Carnosine: Combining a Natural Antioxidant and Geroprotector with “Generally Regarded as Safe” (GRAS) Organic Acids. Cryst. Growth Des. 2017, 17, 3379–3386. [Google Scholar] [CrossRef]
- Lenz, E.; Jensen, K.T.; Blaabjerg, L.I.; Knop, K.; Grohganz, H.; Löbmann, K.; Rades, T.; Kleinebudde, P. Solid-State Properties and Dissolution Behaviour of Tablets Containing Co-Amorphous Indomethacin-Arginine. Eur. J. Pharm. Biopharm. 2015, 96, 44–52. [Google Scholar] [CrossRef]
- Mesallati, H.; Conroy, D.; Hudson, S.; Tajber, L. Preparation and Characterization of Amorphous Ciprofloxacin-Amino Acid Salts. Eur. J. Pharm. Biopharm. 2017, 121, 73–89. [Google Scholar] [CrossRef] [PubMed]
- Park, H.; Jin Seo, H.; Hong, S.H.; Ha, E.S.; Lee, S.; Kim, J.S.; Baek, I.H.; Kim, M.S.; Hwang, S.J. Characterization and Therapeutic Efficacy Evaluation of Glimepiride and L-Arginine Co-Amorphous Formulation Prepared by Supercritical Antisolvent Process: Influence of Molar Ratio and Preparation Methods. Int. J. Pharm. 2020, 581, 119232. [Google Scholar] [CrossRef]
- Liu, J.; Rades, T.; Grohganz, H. Determination of the Optimal Molar Ratio in Amino Acid-Based Coamorphous Systems. ACS Appl. Mater. Interfaces 2020, 17, 1335–1342. [Google Scholar] [CrossRef]
- Martins, I.C.B.; Forte, A.; Diogo, H.P.; Raposo, L.R.; Baptista, P.V.; Fernandes, A.R.; Branco, L.C.; Duarte, M.T. A Solvent-free Strategy to Prepare Amorphous Salts of Folic Acid with Enhanced Solubility and Cell Permeability. Chem. Methods 2022, 2, e202100104. [Google Scholar] [CrossRef]
- Chen, Y.M.; Li, H.; Chiu, Y.S.; Huang, C.C.; Chen, W.C. Supplementation of L-Arginine, L-Glutamine, Vitamin C, Vitamin E, Folic Acid, and Green Tea Extract Enhances Serum Nitric Oxide Content and Antifatigue Activity in Mice. Evid. Based Complement. Altern. Med. 2020, 2020, 8312647. [Google Scholar] [CrossRef] [PubMed]
- Rasic-Markovic, A.; Hrncic, D.; Krstic, D.; Colovic, M.; Djuric, E.; Rankov-Petrovic, B.; Susic, V.; Stanojlovic, O.; Djuric, D. The Effect of Subchronic Supplementation with Folic Acid and L-Arginine on Homocysteine-Induced Seizures. Can. J. Physiol. Pharmacol. 2016, 94, 1083–1089. [Google Scholar] [CrossRef]
- Korokin, M.V.; Pokrovsky, M.V.; Novikov, O.O.; Gureev, V.V.; Denisyuk, T.A.; Korokina, L.V.; Polyanskaya, O.S.; Ragulina, V.A.; Pokrovskaya, T.G.; Danilenko, L.M.; et al. Effect of L-Arginine, Vitamin B6 and Folic Acid on Parameters of Endothelial Dysfunction and Microcirculation in the Placenta in Modeling of L-NAME-Induced NO Deficiency. Bull. Exp. Biol. Med. 2011, 152, 70–72. [Google Scholar] [CrossRef]
- Koc, F.; Ardic, I.; Erdem, S.; Kalay, N.; Ozbek, K.; Yarlioglues, M.; Ceyhan, K.; Celik, A.; Kadi, H.; Taner, A.; et al. Relationship between L-Arginine/Asymmetric Dimethylarginine, Homocysteine, Folic Acid, Vitamin B Levels, and Coronary Artery Ectasia. Coron. Artery Dis. 2010, 21, 445–449. [Google Scholar] [CrossRef]
- Brocardo, P.d.S.; Budni, J.; Lobato, K.R.; Kaster, M.P.; Rodrigues, A.L.S. Antidepressant-like Effect of Folic Acid: Involvement of NMDA Receptors and l-Arginine-Nitric Oxide-Cyclic Guanosine Monophosphate Pathway. Eur. J. Pharmacol. 2008, 598, 37–42. [Google Scholar] [CrossRef] [PubMed]
- Budoff, M.J.; Ahmadi, N.; Gul, K.M.; Liu, S.T.; Flores, F.R.; Tiano, J.; Takasu, J.; Miller, E.; Tsimikas, S. Aged Garlic Extract Supplemented with B Vitamins, Folic Acid and l-Arginine Retards the Progression of Subclinical Atherosclerosis: A Randomized Clinical Trial. Prev. Med. 2009, 49, 101–107. [Google Scholar] [CrossRef] [PubMed]
- Osseyi, E.S.; Wehling, R.L.; Albrecht, J.A. Liquid Chromatographic Method for Determining Added Folic Acid in Fortified Cereal Products. J. Chromatogr. A 1998, 826, 235–240. [Google Scholar] [CrossRef]
- National Center for Biotechnology Information PubChem Compound Summary for CID 135398658, Folic Acid. Available online: https://pubchem.ncbi.nlm.nih.gov/compound/Folic-acid#section=Stability-Shelf-Life (accessed on 12 June 2022).
- FOLIC ACID. CAMEO Chemicals, NOAA. Available online: https://cameochemicals.noaa.gov/chemical/20419 (accessed on 12 June 2022).
- Wu, Z.; Li, X.; Hou, C.; Qian, Y. Solubility of Folic Acid in Water at PH Values between 0 and 7 at Temperatures (298.15, 303.15, and 313.15) K. J. Chem. Eng. Data 2010, 55, 3958–3961. [Google Scholar] [CrossRef]
- Szakács, Z.; Noszál, B. Determination of Dissociation Constants of Folic Acid, Methotrexate, and Other Photolabile Pteridines by Pressure-Assisted Capillary Electrophoresis. Electrophoresis 2006, 27, 3399–3409. [Google Scholar] [CrossRef] [PubMed]
- Zempleni, J.; Suttie, J.W.; Gregory, J.F., III; Stover, P.J. Handbook of Vitamins; CRC Press: Boca Raton, FL, USA, 2014; Volume 52, ISBN 9780849340222. [Google Scholar]
- Macfie, G.; Compton, R.G.; Corti, H.R. Electrical Conductivity and Solubility of KF in N,N-Dimethylformamide up to 125 °C. J. Chem. Eng. Data 2001, 46, 1300–1304. [Google Scholar] [CrossRef]
- Magri, V.R.; Rocha, M.A.; de Matos, C.S.; Petersen, P.A.D.; Leroux, F.; Petrilli, H.M.; Constantino, V.R.L. Folic Acid and Sodium Folate Salts: Thermal Behavior and Spectroscopic (IR, Raman, and Solid-State 13C NMR) Characterization. Spectrochim. Acta A Mol. Biomol. Spectrosc. 2022, 273, 120981. [Google Scholar] [CrossRef]
- Akhgari, A.; Iraji, P.; Rahiman, N.; Farouji, A.H.; Abbaspour, M. Preparation of Stable Enteric Folic Acid-Loaded Microfiber Using the Electrospinning Method. Iran. J. Basic. Med. Sci. 2022, 25, 405–413. [Google Scholar] [CrossRef]
- Bellavinha, K.R.; Silva-Barcellos, N.M.; Souza, J.B.; Leite, J.C.; De Souza, J. Folic Acid: A Biopharmaceutical Evaluation. Pharm. Dev. Technol. 2015, 20, 730–737. [Google Scholar] [CrossRef]
- Jain, S.; Patel, N.; Lin, S. Solubility and Dissolution Enhancement Strategies: Current Understanding and Recent Trends. Drug Dev. Ind. Pharm. 2015, 41, 875–887. [Google Scholar] [CrossRef]

