


1. Introduction
Breast cancer (BC) remains a major public health issue worldwide and is the second leading cause of death among women annually [1]. There is compelling evidence that early detection by mammography screening improves prognosis and reduces mortality rates from BC even though risks of overdiagnosis, over-treatment and psychological impacts cannot be discounted [2,3].
Currently, most organized BC screening programs are offered to women based solely on their age, from age 40–50 to age 70–74, depending on the country [4,5]. Although the risk of developing BC increases with age, genetic, environmental, lifestyle, reproductive and hormonal factors have been found to be associated with the risk of developing the disease [6]. In this context, risk-stratified BC screening, in which individual risk assessment based on multiple risk factors is used to tailor screening recommendations (e.g., more screening for women at higher risk and less screening for those at lower risk), has been proposed as an alternative to the current age-based approach [7,8,9]. Developing and validating accurate BC risk prediction tools is therefore critical to achieving optimal risk-stratified BC screening strategies.
Genome-wide association studies (GWAS) have identified common, low-penetrance genetic variants associated with BC risk [10,11]. Although individually, these variants confer minimal risk of BC, their effect becomes significant when aggregated as a polygenic risk score [(PRS), also known as genetic risk score—GRS] [12]. This PRS can be used alone or incorporated into a risk prediction model to identify women at higher risk of developing BC [13,14]. At the population level, risk prediction tools could be used to stratify healthy women based on their risk level of developing cancer in a certain time period (commonly 5 or 10 years) in order to adapt preventive measures [15,16,17]. While risk prediction models aim to predict the probability of an event occurring in individuals based on a combination of factors, risk prediction tools are the means by which these models are implemented in clinical or public health practice [18]. Commonly used tools to predict BC risk include the Breast Cancer Risk Assessment Tool (BCRAT; also referred to as the Gail model) [19], the International Breast Cancer Intervention Study model (IBIS; the Tyrer–Cuzick model) [20], BRCAPRO risk assessment tool [21], and the Breast and Ovarian Analysis of Disease Incidence and Carrier Estimation Algorithm model (BOADICEA) [13,22]. Clinical-grade tests to measure PRS are now available, and several BC risk prediction tools, including IBIS and BOACIDEA, have been extended to include a PRS value [13,23,24,25].
For a risk prediction tool based on or incorporating a PRS to be clinically useful for prevention or early detection, it must provide good risk discrimination between individuals who will develop the disease and those who will not and account for the population risk of the disease. Even if a model is well-calibrated to predict different risk categories, its ability to stratify groups of individuals in the population with a sufficient difference in absolute risk to justify additional preventive interventions plays an important role in its clinical utility [23]. Nonetheless, considerable heterogeneity in PRS development methods brings uncertainty and potential bias to BC risk prediction tools incorporating a PRS [26].
To date, there is no critical assessment regarding the development, performance, and risk of bias of BC risk prediction tools that include a PRS. In addition, population characteristics for which these tools are best suited remain to be further investigated. Finally, we need to understand the current validation processes of these tools and the existence of comparative studies to envision how they could apply to clinical or public health practices. Thus, we conducted this systematic review to help fill this gap in the literature. Our specific aims are to (1) identify, characterize, and summarise the different prediction risk models incorporating a PRS to estimate the risk of developing BC in women in the general population; and (2) assess the risk of bias of individual studies reporting on their performance.
2. Methods
2.1. Protocol and Registration
A systematic review protocol was published in the International Prospective Register of Systematic Reviews PROSPERO (PROSPERO 2020 CRD42020198930 available at https://www.crd.york.ac.uk/prospero/display_record.php?RecordID=198930 (accessed on 6 November 2023).
2.2. Search Strategy
This systematic review followed PICOTS and PRISMA guidelines [27,28]. We proceeded to a first search of the Medline, EMBASE databases and the Cochrane Library up to June 2021 using the strategy presented in . We then updated our search to retrieve relevant literature up to November 2022. Our search strategy, adapted for each database, consisted of a combination of keywords and controlled vocabulary for three concepts: “breast cancer”, “polygenic risk score or genetic risk score” and “cancer risk prediction tools”. We also manually screened bibliographic references of all included papers and other relevant systematic reviews or meta-analyses to retrieve additional studies.
2.3. Eligibility Criteria
We included studies reporting original research published in a peer-reviewed journal describing the development and/or validation of prediction models incorporating a PRS and using it to estimate the risk of developing BC for adult women in the general population. We defined the general population as a cohort representing women typically considered at average risk of developing BC. Therefore, we excluded studies including individuals with a history of BC or focusing on specific population groups (e.g., individuals with a known mutation in BRCA1 or BRCA2 genes, nurses’ study, hereditary BC risk in a familial setting, etc.). The prediction models included in this review could either use only genetic factors in the form of a PRS or a combination of genetic and non-genetic risk factors. To be included in our review, studies needed to meet the following criteria: (1) describe the development and/or validation of a prediction model; (2) use at least two SNPs in the form of a PRS or GRS; (3) predict the risk of developing BC for a specified period in an individual’s life (e.g., 5 or 10-year risk, lifetime or remaining lifetime risk); (4) report a measure of performance to assess the predictive capacity of the model (i.e., measure of discrimination (e.g., C-statistic, AUC), or calibration (e.g., Hosmer–Lemeshow statistic)). Articles published in French or English and with any study design were considered without restriction on the publication year.
2.4. Study Selection
Two independent reviewers (C. Mbuya-Bienge and C.D. Kazemali) screened the titles and abstracts. A first pilot selection of titles and abstracts was conducted from a random sample of 10% of the identified articles to verify the clarity and consistency of inclusion criteria. Since the kappa statistic was 0.9 for this pilot, indicating no significant problems, no changes were made to the selection process and criteria. The full text of all potentially relevant studies was also assessed independently by the two researchers. When a consensus to include or exclude a study could not be reached, a senior researcher (H. Nabi) made the final decision.
2.5. Data Extraction Process and Analysis
Data extraction was undertaken independently by the same two researchers (C. Mbuya-Bienge and C.D. Kazemali) using a grid based on the CHARMS checklist of relevant items to extract from individual studies of prediction tools [29]. Data were extracted into tables divided into four categories that influence the models’ validity and utility: (1) study characteristics, (2) outcomes and predictors, (3) model development and (4) model performance and validation. Study characteristics included information such as study design, source of data, study population size, study population characteristics (e.g., ethnicity) and type of study according to the TRIPOD guidelines [30] (e.g., development only (1a); development and validation using resampling (1b); random (2a) or non-random (2b) split sample development and validation; development and validation using a separate data (3); and validation only (4)). Outcomes and predictors were assessed based on the studies’ definition and method for measuring the outcomes and predictors, handling of predictors and selecting genetic and non-genetic predictors. For the model development phase, we considered the handling of missing data, the modelling method and the model presentation. Model performance and validation were assessed from the reported measure of performance, the classification measures if available and the method of internal or external validation if applicable.
The heterogeneity of model characteristics in terms of predictors and outcomes precluded the possibility of pooling data across studies. Therefore, a narrative synthesis was conducted. Key study characteristics, validation and accuracy of individual risk prediction models, as well as the methodological quality, are described in tables and summarised narratively. We presented the studies’ main measure of discrimination and its 95% confidence interval (CI), when provided, using a forest plot. The measures of discrimination, such as the area under the receiver operating characteristics curve (AUROC or AUC) or the concordance statistics (c-statistics), indicate how well patients can be classified into two groups (usually the cases with the disease and the controls without the disease). Possible values range between 0.0 and 1.0 with a value of 1.0 indicating that the model has a perfect classification accuracy and 0.5 indicating that the classification is not better than a random classification. On rare occasions, the value can be less than 0.5, indicating that the model has an inaccurate classification accuracy (i.e., it performs worse than chance) [31,32]. When the same study reported performance measures for multiple steps of the same model (e.g., model development and internal validation), only the best-performing model was included in our main analysis. When an article presented performance measures for the development of a model and external validation on a different population (TRIPOD level 3), both models were included in our analysis. If a performance measure was presented separately for a model including only a PRS and the same model combining the PRS with genetic and non-genetic risk factors, both models were considered separately. The same method was performed if a model presented results for different subtypes of BC or different ethnicities. However, if a study presented different performance measures for the PRS and some genetic and non-genetic risk factors individually, only the most comprehensive model was retained.
We also presented the calibration assessed with the Hosmer–Lemeshow test or the expected-to-observed (E/O) ratio, and the reclassification assessed with the net reclassification index (NRI) when available. The Hosmer–Lemeshow test provides a chi-square and p-value that indicates the goodness of fit. When this test is not statistically significant, it indicates a lack of evidence of model miscalibration. The expected-to-observed (E/O) ratio provides a ratio of the total expected number of cases (individuals with the outcome) to the observed number of cases. A value of 1 indicates that the model is perfectly calibrated, while values less than 1 and above 1 indicate, respectively, that the model is either underpredicting or overpredicting the total number of cases in the population [31]. The NRI seeks to quantify the agreement between risk classification and event status (cases and controls) when comparing an old model to a new model given a set of predefined risk categories. It allows evaluating the incremental value in the predictive capacity of new predictors to an existing set of predictors. The statistic is calculated as follows P(up|case) − P(down|case) + P(down|control − P(up|control), and its value ranges between −2 and 2. The terms “up” and “down”, respectively, refer to a new risk model placing an individual into a higher risk category or a lower risk category compared to the old model [33,34].
Finally, we performed sensitivity analyses by using multiple comparative assessments based on characteristics such as the populations on which the model was developed, the number of SNPs, the type of risk prediction tools used, the BC subtype and the age category to determine their impact on the models’ performance.
2.6. Risk of Bias of Individual Studies
We used PROBAST Prediction model Risk Of Bias Assessment Tool) [35], a tool which is organized into four domains (participants, predictors, outcome and analysis) to assess the risk of bias of individual studies that developed or validated multivariable diagnosis or prognosis prediction models. We used the same classification as the tool to indicate whether the studies were at low (+), high (−) or unclear (?) risk of bias for each domain separately. Based on our classification for each domain, we followed the PROBAST’s method [35] to determine the overall risk of bias for a study.
3. Results
3.1. Study Selection
A total of 7377 records were found from our search strategy after removing duplicates. We excluded 7191 records after screening their titles and abstracts and assessed the full text of 186 papers. A flow diagram of the selection process is presented in Figure 1. At the full-text level, the main reasons for exclusion were that the studies did not include a PRS or a GRS (n = 53) and did not present a predictive model (n = 28) or a measure of performance (n = 19). Additionally, seven studies did not present a risk prediction model for the general population as two of them were developed on a population of working nurses [36,37], and five were developed either for women at increased familial risk of BC [38,39], with a previous diagnosis of BC [40,41] or with known genetic mutations [42]. Two additional studies were identified via reference screening of the included studies. In total, we included 37 studies [12,23,24,25,43,44,45,46,47,48,49,50,51,52,53,54,55,56,57,58,59,60,61,62,63,64,65,66,67,68,69,70,71,72,73,74,75] in our systematic review, presenting seven different risk prediction tools.
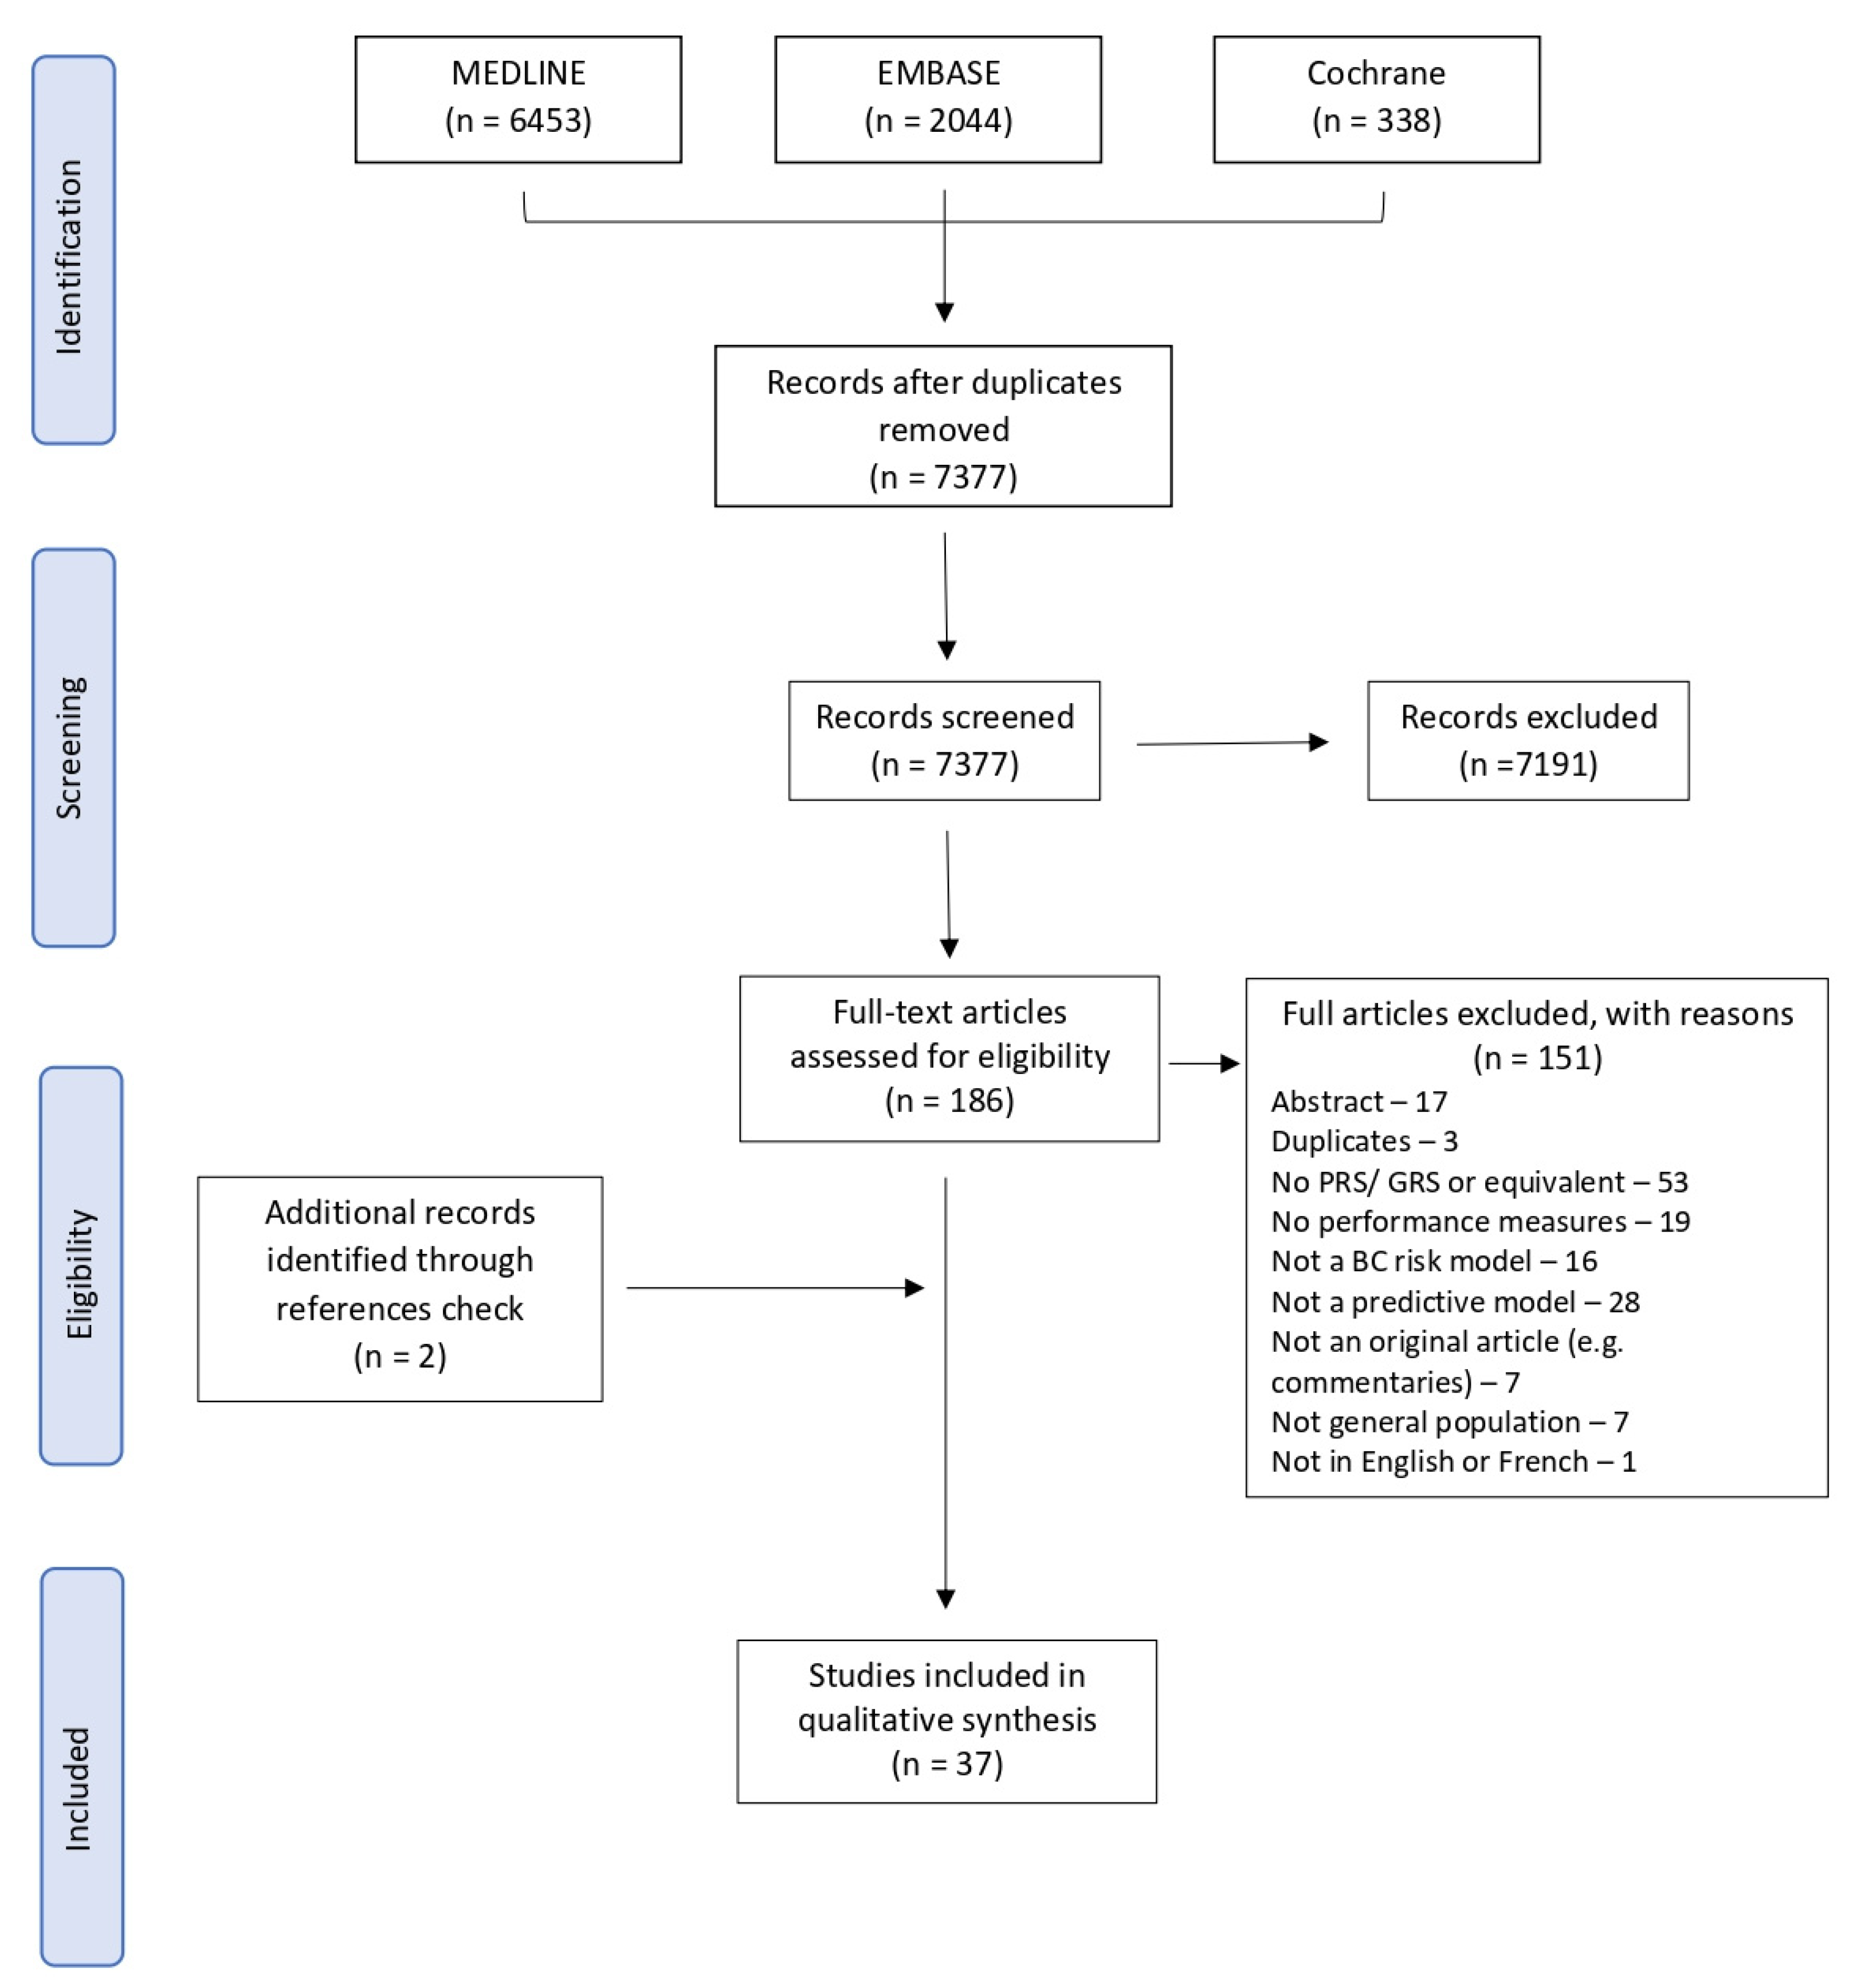
Figure 1. PRISMA flowchart of exclusion criteria.
3.2. Characteristics of Included Studies
The main characteristics of individual studies are presented in . Studies included in this review presented the risk for different types of BC. Most predicted the risk of developing overall BC (n = 25) [12,24,25,43,44,45,46,49,51,54,56,58,61,62,63,64,65,66,67,69,70,71,72,74,75] or invasive BC (n = 11) [47,48,50,52,53,55,57,59,63,68,73], and BC subtypes such as ER-positive (n = 11) [7,12,45,47,48,49,50,52,57,67,70] and ER-negative (n = 10) [12,45,47,48,49,50,52,57,67,70]. Most studies were conducted in the United States (n = 7) [7,43,44,57,59,61,74], the United Kingdom (n = 5) [25,45,62,69,75], Sweden (n = 3) [23,46,66] and Australia (n = 3) [47,48,73]. Seven studies were conducted in Asian countries [54,65,70], including four in multiple countries [50,64,68,72]. Of our 37 studies, 8 (21.6%) [12,49,50,56,64,67,68,74] presented models with only genetic factors. The number of SNPs used to calculate the PRS varied between 7 [57] and 5218 [74]. Most studies selected SNPs based on previously identified SNPs from published studies. Others selected SNPs associated with BC at a predefined threshold, level of significance or associated specifically with a certain ancestry group. The most common development method of the PRS was based on the cumulative effect of the per-allele odds ratio and the number of risk alleles [57]. However, newer methods such as Bayesian approaches [7,59] or risk prediction algorithms [72] were also used. Nineteen studies presented only the development of a risk model [7,43,46,47,48,49,52,54,55,56,57,59,62,63,64,65,66,67,71], and fourteen presented only its validation [23,24,25,44,45,50,51,53,58,61,69,73,74,75]. Nine included a method of internal validation [49,52,56,57,59,60,65,67,71], and four studies externally validated their model [12,68,70,72]. As for studies combining genetic and non-genetic risk factors, the selection of non-genetic risk factors was mostly based on those included in previously validated prediction tools such as the BCRAT [43,44,45,46,47,48,52,53,54,57,58,61] or IBIS [25,43,45,48,53,58,62,69,73]. Studies sample size ranged from 39 to 33,673 cases and 51 to 286,801 controls . Twelve studies used logistic regression to create the final model combining the PRS and genetic and non-genetic risk factors [7,43,44,45,52,55,59,63,66,69,70,75], and two used Cox regression [54,71].
3.3. Characteristics of Risk Prediction Models
shows the main non-genetic predictors used in combined models. The number of predictors included in the models varied between one [75] and twenty-five [58]. Almost all models used the current age of women as a predictor of BC. Age was considered either by directly introducing it in the models as an independent variable or by stratifying by age groups [25,47,51,58,73]. Age at menarche, age at menopause, age at first live birth and family history of BC were also used in the majority of models. Details on participants and risk models are shown in . Most models (55.0%) were developed or validated in populations of European descent, 26.3% in Asian populations, 12.5% in populations of African descent and 6.3% in Hispanic populations. A little more than 55%, 30% and 15% of the models estimated the 5-year, 10-year and lifetime risk of developing BC, respectively. In addition, one model estimated the 2-year [66] and 3-year [71] BC risk. Among the models based on a combination of genetic and non-genetic risk factors, 32.7% were an upgraded version of the BCRAT, 21.2% of the IBIS, 9.6% of the Breast Cancer Surveillance Consortium (BCSC) and 7.7% on the BOADICEA tool.
3.4. Discriminatory Accuracy
Figure 2 and Figure 3 show the discriminative performance of the individual risk models and their 95% confidence intervals (CI) when provided. For the models including a PRS only, 105 measures of discrimination were reported representing different versions of certain models . The discrimination measure values ranged from 0.48 (95% CI = 0.43–0.53) [74] to 0.68 (95% CI = 0.61–0.75) [7]. For models including a combination of genetic and non-genetic factors, a total of 93 measures of discrimination were also reported. The discrimination measure values ranged from 0.52 (95% CI = 0.48–0.57) [57] to 0.77 (95% CI = 0.75–0.79) [66]. The model by Shieh et al. (2017) [7], including only a PRS, had the best predictive capacity and predicted the 5-year ER-positive risk in women of European descent, whereas the one by Liu et al. (2021) [74] had the lowest predictive capacity and predicted the 5-year overall BC risk in women of Latinx descent. The combined model by Erikson et al. (2020) [66] had the best predictive capacity and predicted the 2-year overall BC risk in women of European descent, and the combined model by Mealiffe et al. (2010) [57] had the lowest predictive capacity and estimated the 5-year risk of ER-negative BC in women of European descent. Due to differences in outcomes, predictors and time frame, direct comparisons between models could not be made; thus, these results are intended only to provide an overview of the models’ performance.
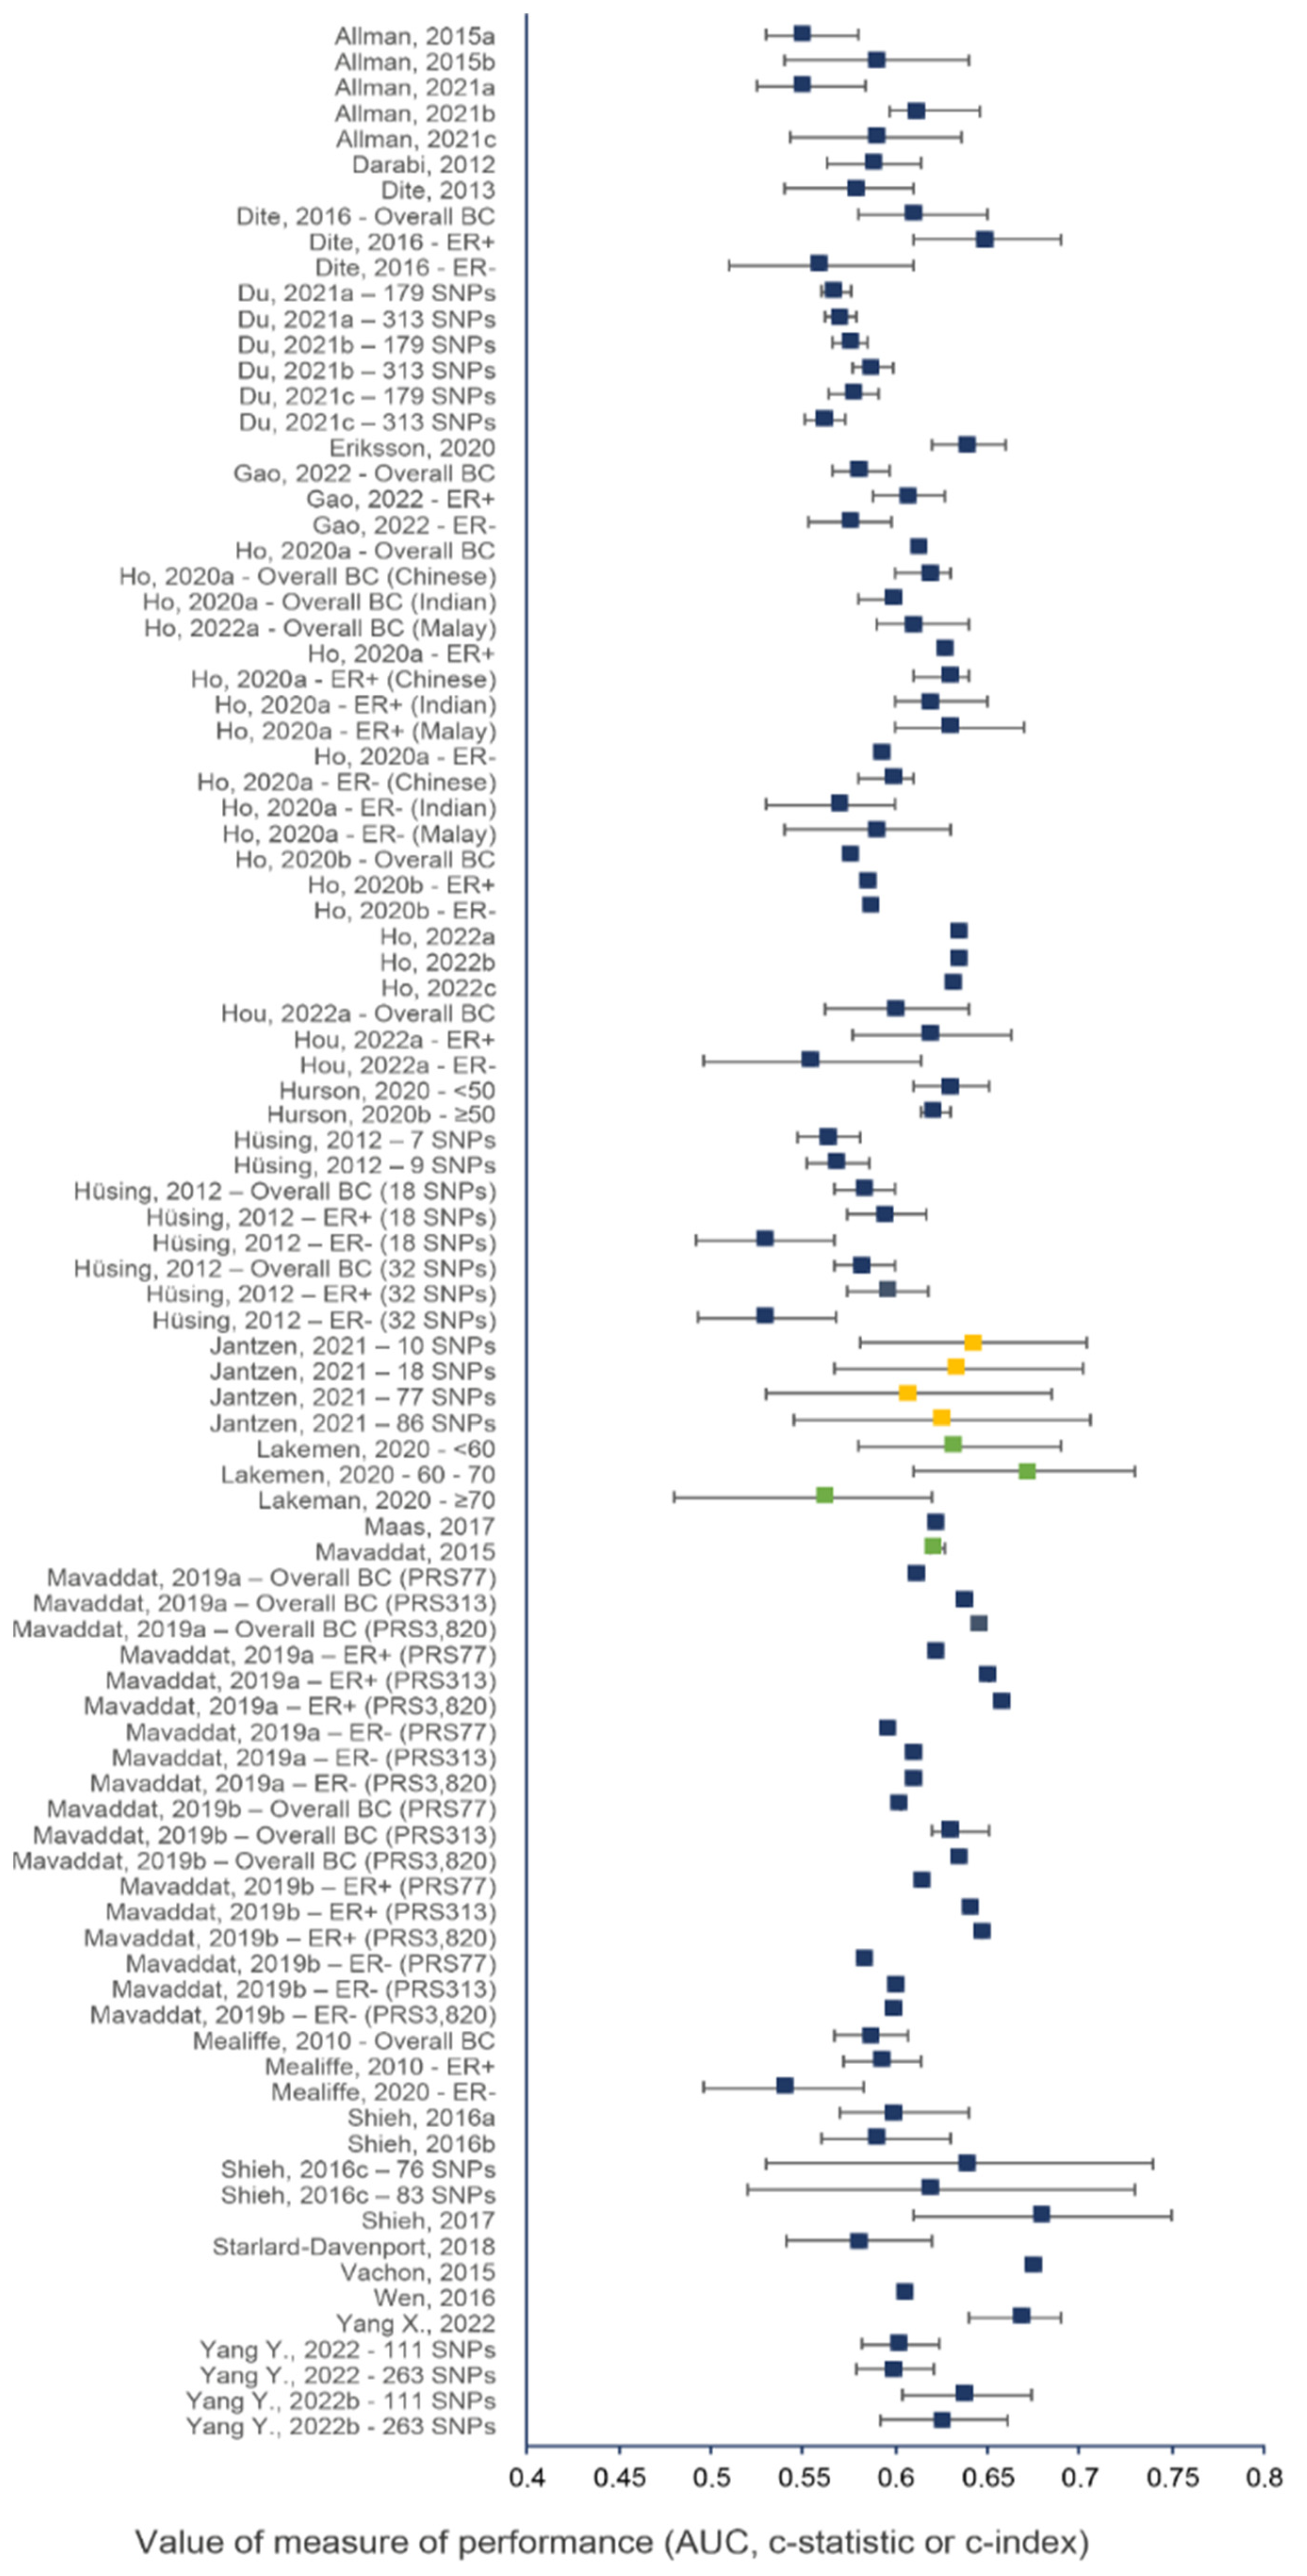
Figure 2. Discriminative performance of individual risk models, including only a PRS. Each dot represents a measure of discrimination for different versions (represented by the letters when applicable) of risk models as described in . The horizontal segment represents the 95% CIs when provided. Blue, green and yellow dots indicate that the AUC, c-statistic and c-index were the measure of performance, respectively.
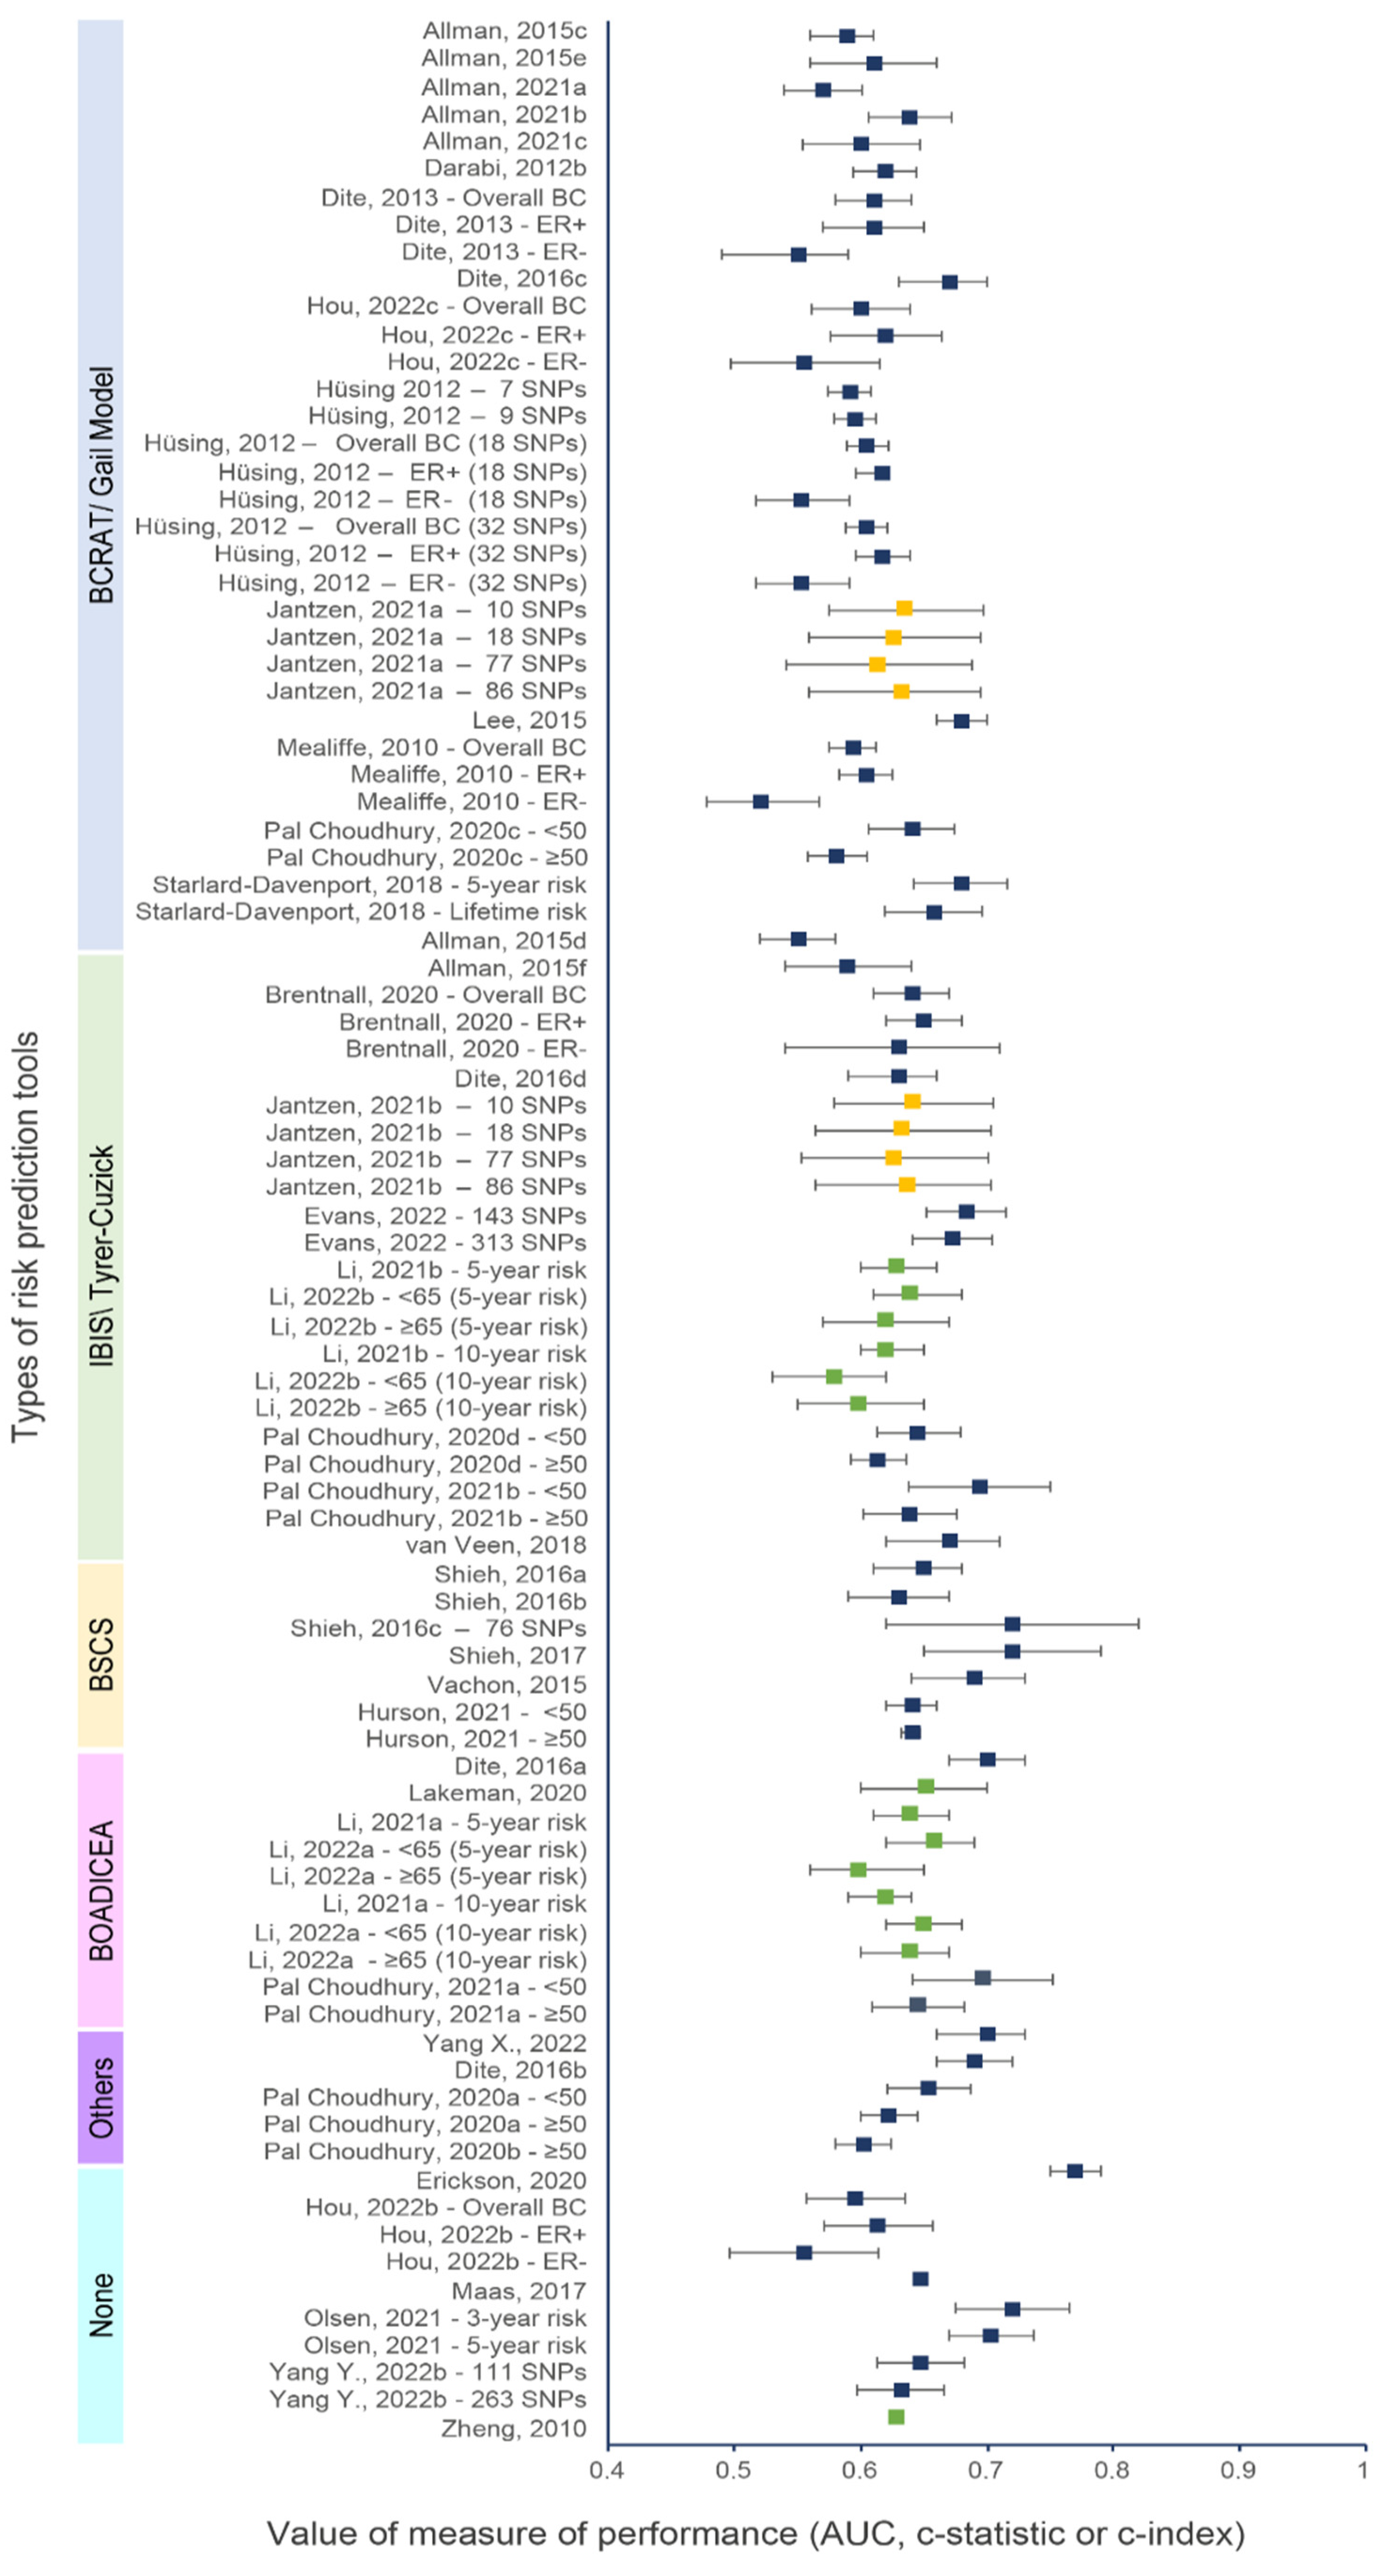
Figure 3. Discriminative performance of individual risk tools for models including a PRS and genetic and non-genetic risk factors. Each dot represents a measure of discrimination for different versions (represented by the letters when applicable) of risk models as described in . The horizontal segment represents the 95% CIs when provided. Blue, green and yellow dots indicate that the AUC, c-statistic and c-index were the measure of performance, respectively.
3.5. Calibration Accuracy
Of the 37 studies, 20 (54.1%) provided a measure of calibration for their models (details shown in ) [12,23,24,25,43,45,46,47,48,51,53,57,58,59,61,62,63,70,71,73]. Most studies used the Hosmer–Lemeshow test or the expected-to-observed (E/O) ratio. A few studies also provided a calibration slope or plots. When looking at the Hosmer–Lemeshow test, most models had p-values greater than 0.05, indicating no evidence of the data not fitting the models. Indeed, since the Hosmer–Lemeshow test is often underpowered, a p-value greater than a threshold should not by itself justify good calibration. On the other hand, the E/O ratio had values ranging from 0.73 (95% CI: 0.63–0.85) [73] to 1.23 (95% CI: 0.18–2.28) [70], indicating that models were either underpredicting or overpredicting the risk of BC.
3.6. Net Reclassification Improvement
A measure of reclassification was provided in twelve studies [23,43,46,47,48,51,52,57,61,63,65,71]. All but three studies [23,51,65] used the NRI to quantify the discriminatory ability of the combined models with a PRS and genetic and non-genetic risk factors compared to the same model without the PRS. Studies usually used a net reclassification measure for cases (identified as events—NRIe) and controls (identified as nonevents–NRIne) at a predefined risk threshold. NRI values ranged from −0.029 (p-value = 0.5) [47] to 0.181 (95% CI 0.09–0.27) [43]. In general, the addition of the PRS to clinical risk prediction tools such as the BCRAT or IBIS improved the classification of patients, with cases going into higher risk categories and controls into lower risk categories.
3.7. Sensitivity Analysis
3.8. Quality of Reporting
The TRIPOD checklist considers 22 items to be essential for good reporting of studies developing or validating multivariable prediction models [30]. Of the 37 studies, only four encompassed all the items on the checklist. The vast majority of studies did not follow the title’s recommendation. Namely, they did not identify if the study was either a development or a validation model. In the methods, the description of how the missing data were handled was the most omitted item. For most studies, the results section was clear and complete. However, seven studies did not report confidence intervals for all discriminative measures [12,50,55,63,64,65,68]. Also, as recommended by the TRIPOD guidelines, calibration performance should be included in all prediction models, but it was assessed less often than discriminative performance. All studies reported their limitations and provided an overall interpretation of their results given those limitations. Finally, other information, such as , was often provided, and a funding statement was present in all studies.
3.9. Risk of Bias within Studies
Assessment of the risk of bias is presented in Figure 4 based on the four domains of the PROBAST tool [35]. Overall, 19 studies were at low risk of bias, 7 were at high risk and 11 were at unknown risk of bias. When the participant domain was at unclear risk, it was mostly because participants’ inclusion or exclusion criteria were not described or not described with enough details to determine if they were appropriate. For the predictors’ domain, the main reason for the high or unclear risk of bias was the absence of important predictors such as age when the model was developed or validated. A couple of studies were concerning for the outcome domain since it was unclear whether the outcome was a preclinical stage of cancer [66,71]. Most risks of bias occurred in the analysis domain as many development models did not account for complexities in the data, such as competing risk or model overfitting, underfitting and optimism, or did not explain how they handled missing data. These risks of bias, such as the potential overfitting, were mentioned in some studies [64,68,72].
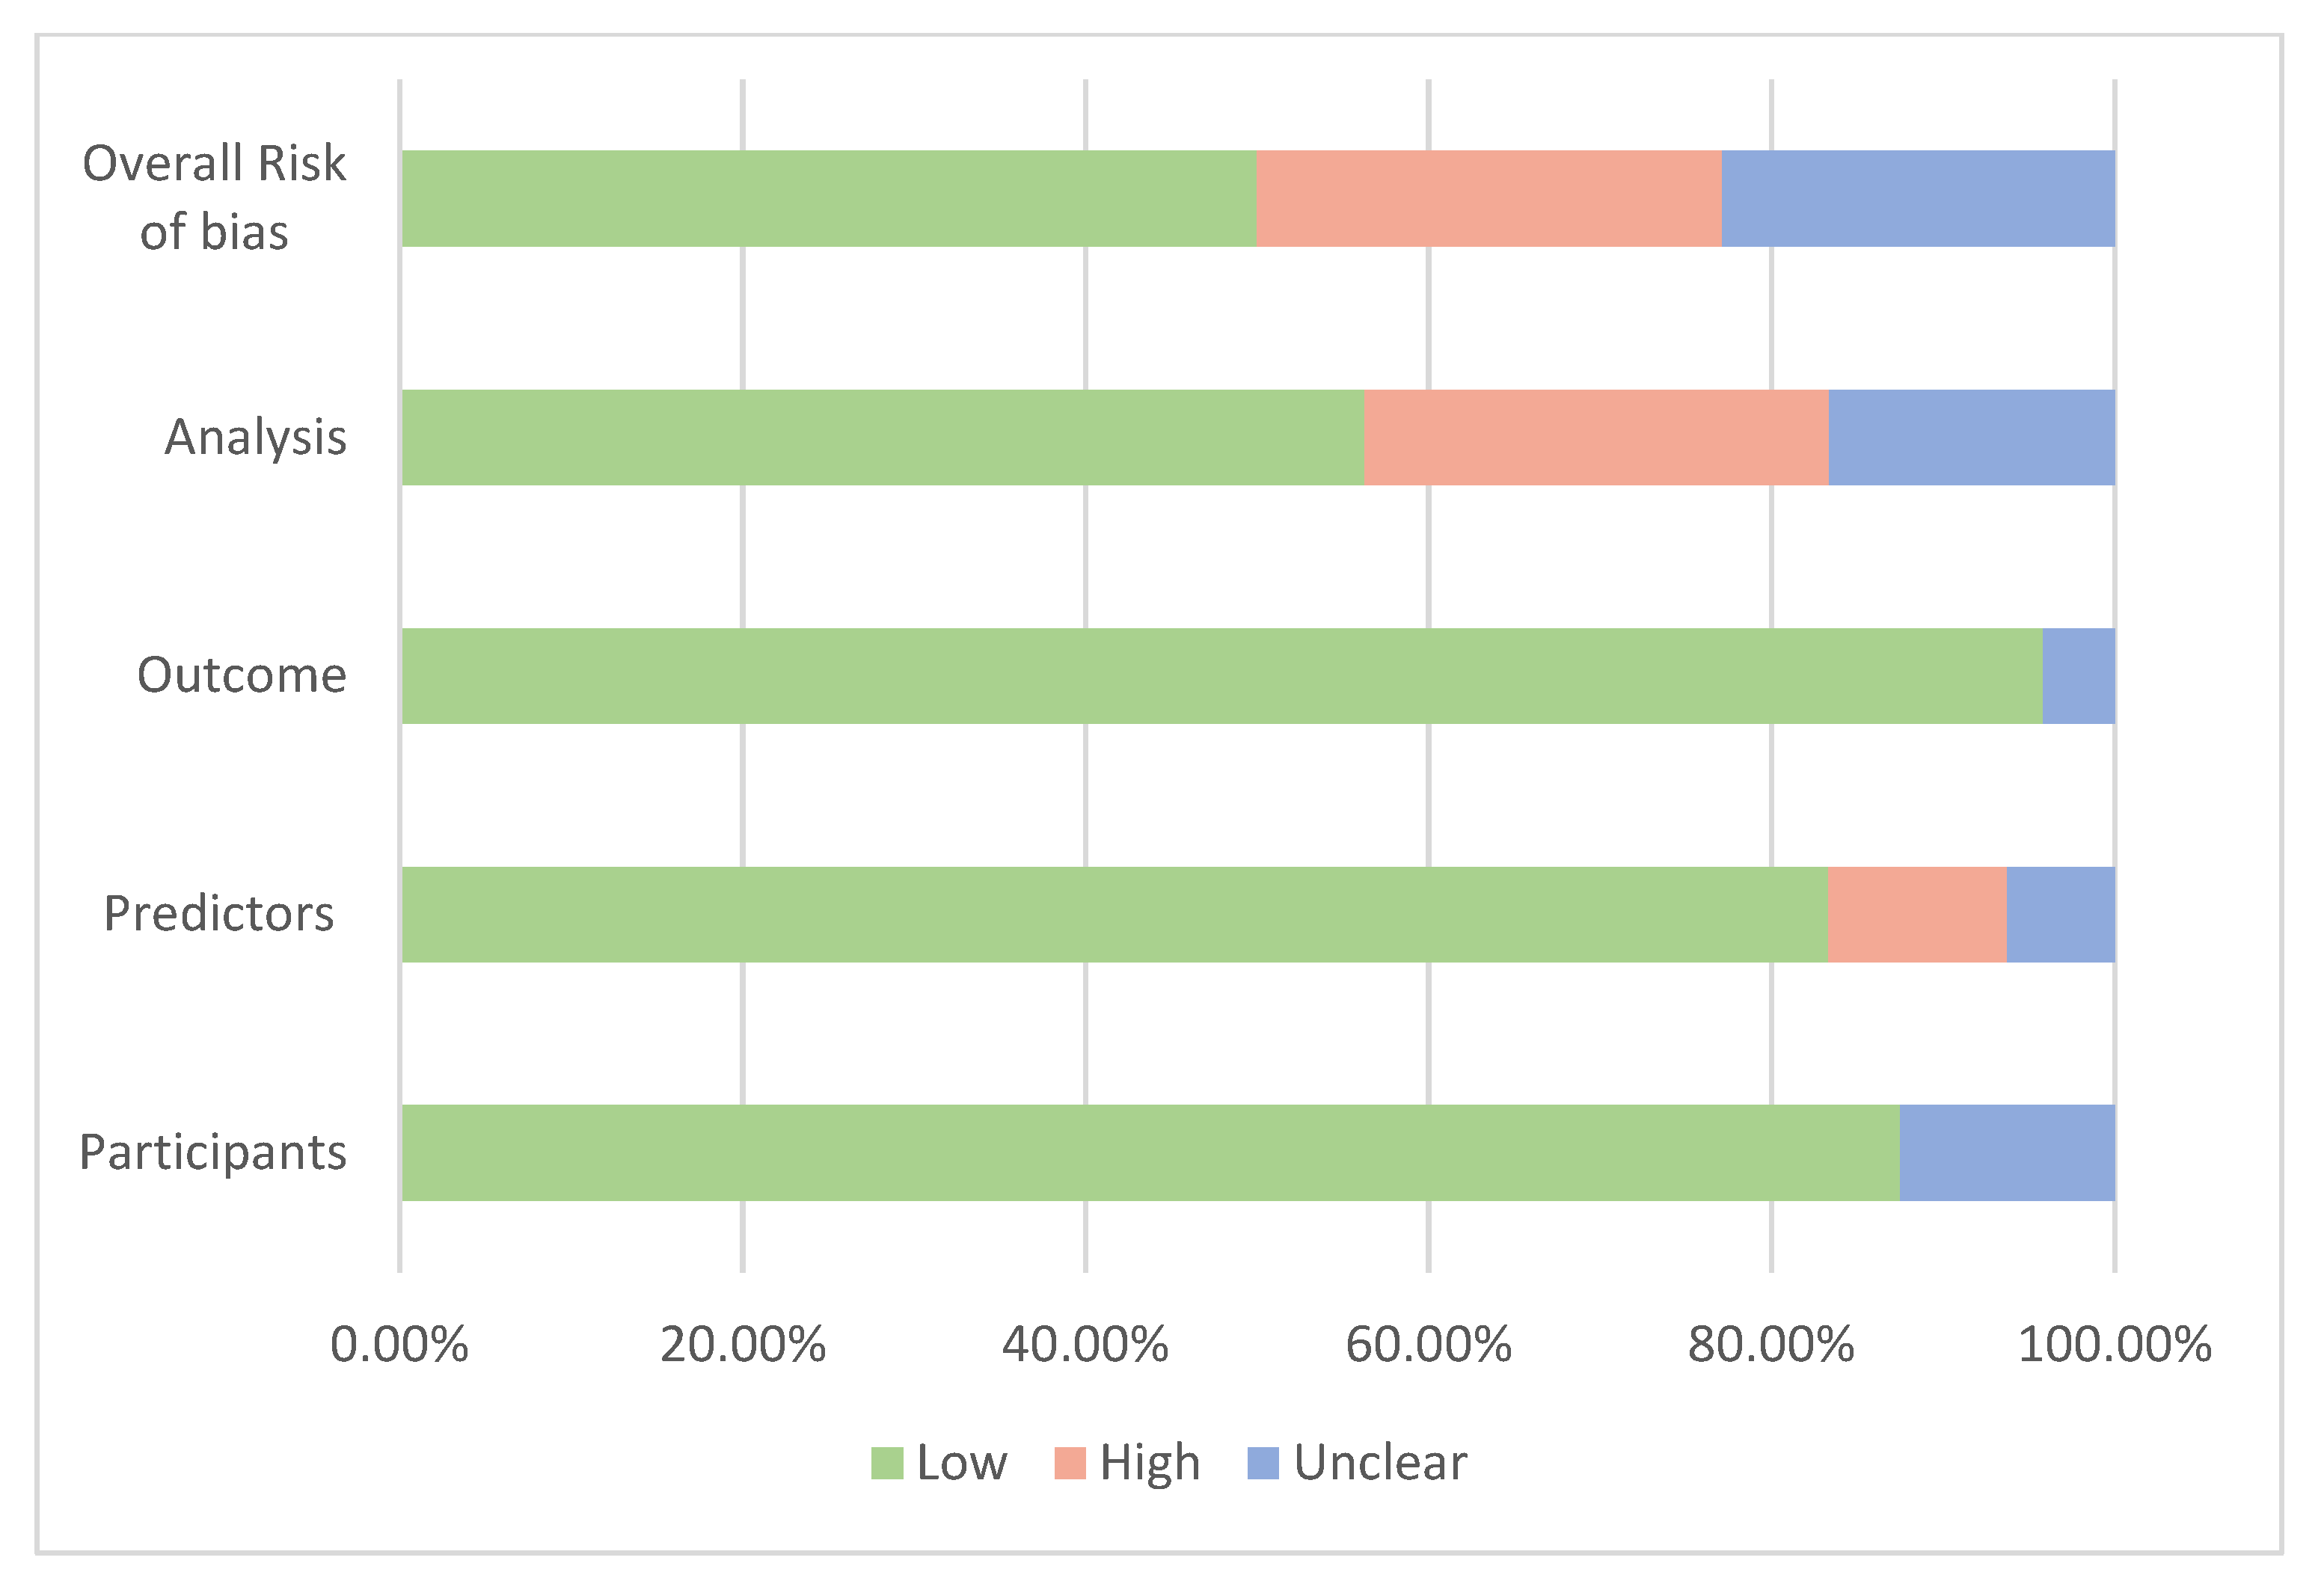
Figure 4. Summary of the assessment of risk of bias.
4. Discussion
The goal of this systematic review was to appraise and critically assess different prediction models incorporating a PRS used to estimate the risk of developing BC for women in the general population. We identified 37 studies, of which 8 included genetic factors only, whereas the rest combined genetic and non-genetic risk factors. The combined models were based on 7 different risk prediction tools and provided 93 measures of discrimination. For models’ development, the median value of discriminative performance measures was 0.60 (range = 0.53 to 0.68) for models with PRS only and 0.62 (range = 0.52 to 0.77) for models combining PRS and genetic and non-genetic risk factors. For the models’ validation, the median value of discriminative performance measures was 0.61 (range = 0.48 to 0.67) for models with PRS only and 0.64 (range = 0.55 to 0.70) for models combing PRS and genetic and non-genetic risk factors. Although the increase in AUC from the combination of the PRS and genetic and non-genetic risk factors may look small, from a public health perspective, even a modest increase in discriminative performance may lead to a considerable improvement in overall risk stratification levels and be clinically meaningful [23].
Comprehensive BC risk prediction tools incorporating known risk factors could have two potential applications. They can be used as risk-stratification tools to improve the ability to identify women in the general population at increased risk who would most likely benefit from personalized screening recommendations. They can also be used as risk prediction tools to predict the risk of developing overall BC and molecular subtypes in healthy women. However, there are many aspects to consider when evaluating if these tools could be part of clinical routine or public health practices for risk prediction and stratification. The first is to determine the models’ capacity to predict the outcome of interest in a defined population, known as the analytical validity [8]. The second is to evaluate the clinical utility of the tools (i.e., their usefulness, benefits and harms) [8]. The first aspect may be taken into account by evaluating, as performed in this review, the discriminating capacity, the calibration or the fit of a model and, additionally, other performance measures such as the net reclassification index that has been proposed as an alternative or adjunct to discrimination and calibration measures [18].
A first consideration when assessing the predictive performance of a model is that a risk prediction model should be developed in one sample of a data set and validated in a separate independent sample or new data [30]. In fact, associations between risk factors and BC derived from the same data set in which the model was developed may occur by chance due to multiple testing. This problem becomes important with a relatively small sample size with many risk factors included in the model. In studies with small sample size, there is a serious risk of selecting unimportant variables and omitting some variables relevant to the model [86]. At the same time, studies with a very large sample size are more likely to include statistically significant variables but with little clinical importance [87]. Simulation studies have suggested that the ideal number of subjects with events should be at least 10 and safer with 20 or more per risk factor in order to build a valid model [88,89]. As per the results of our review, the number of variables included in the models varied from 2 to 25 variables, so the required number of BC cases should range between 20 and 500 subjects. In this regard, two models could present issues. The model estimating the 10-year ER-negative BC risk by Brentnall et al. (2020) [45] with an AUC of 0.63 (95% CI: 0.54–0.71) had 39 cases for 7 predictors, including the PRS score. The same situation is also present with the model by Shieh et al. (2016) [59] with an AUC of 0.72 (95% CI: 0.65–0.79) but 51 cases for 7 predictors, including the PRS score. Therefore, these models could lead to overoptimistic results in the validation data [90]. However, robust methods can facilitate variable selection, especially when there is a large number of predictors, and can account for many challenges in SNP selection and model specification [91]. Thus, some studies have used more sophisticated methods to select or develop their PRS, such as penalized regression or Bayesian approach [12,67,68,70,72] and show promising results, particularly in diverse populations.
As models perform better in the sample in which they were developed rather than in a different sample or a completely new population, model development should include a validation process. However, about a third of the models did not present any validation (i.e., internal or external validation), which brings concerns regarding the validity of some models as they might not be ready to be used. Nonetheless, several studies were a validation or an extension of existing prediction models. While the addition of a PRS to existing models increased their discriminative accuracy, the number of SNPs considered in the PRS varied widely from one study to another. It could be another factor influencing their predictive performance. SNPs included in a PRS should be inherited independently (i.e., in linkage equilibrium). Some studies excluded SNPs in high linkage disequilibrium from those reported in the original study [75] or used them as proxies for risk variants not available in their dataset [52,59,75]. With the discovery of more SNPs from larger GWAS, the AUC of the risk prediction models is improving. For instance, the oldest model by Mealiffe et al. (2010) [57] had an AUC of 0.58 (95% CI: 0.57–0.60) for the prediction of overall BC using only a 7 SNP-PRS while a more recent model by Mavaddat et al. (2019) [12] had an AUC of 0.63 (95% CI: 0.63–0.65) for the prediction of overall BC using only a 313 SNP-PRS. Since a small improvement in AUC can have a significant impact on risk stratification, one relevant parameter to evaluate a PRS should be the proportion of the polygenic variance attributable to the PRS as expressed by the odds ratio per 1 standard deviation [14].
Another consideration when developing a risk prediction tool is to choose the timeframe for which risk should be predicted [18]. Follow-up time has been shown to have an impact on discriminative accuracy measures such as the concordance index and is likely important to understand differences in predictive ability [92,93]. In our review, the model with the highest discriminative accuracy had the shortest prediction time frame. In fact, the model by Eriksson et al. (2020) [66] had an AUC of 0.77 (CI 95%: 0.75–0.79) but estimated the 2-year BC risk, whereas most models predicted the 5-year, 10-year or lifetime risk. However, models evaluating short time frames would likely identify existing cancers or preclinical cases. The lead time for BC, which is the period between the early detection of BC by screening and the moment the cancer clinically presents or is diagnosed, is about two to three years [94]. Thus, models predicting two or three-year risk are more likely to be diagnostic tools and be considered as screening tests. Tools with longer timeframes could be more effective in predicting BC risk in a screening setting for risk stratification and be used as complements of early detection tools [66].
The choice of the risk prediction tool, especially in a public health setting, should also be examined [18]. In our review, based on the latest version of the risk prediction tools and considering the overall risk of bias and the population size, we observed that the best combined models were validation models derived from the BOADICEAv.6 and the Tyrer–Cuzick v.8 tools [23,25]. Both models predicted the 5-year risk of overall BC in White women and used the 313-SNP PRS developed by Mavaddat et al.(2019) [12]. Although both models have limitations, including that they are not as well-calibrated in non-White populations, the Tyrer–Cuzick tool for women over 50 provided an AUC of 0.69 (95% CI: 0.64–0.75), and the BOADICEA provided an AUC of 0.70 (95% CI: 0.66–0.73). The Tyrer–Cuzick tool used a wide range of non-genetic risk factors but was missing important risk factors such as breast density. The BOADICEA tool was the most comprehensive, combining genetic risk factors such as the PRS and pathogenic variants in BC susceptibility genes as well as non-genetic risk factors, including breast density.
Some tools included predictors easily collected in routine clinical practice or even by questionnaires like smoking status and BMI, whereas others include predictors requiring an extensive medical examination. For example, biopsy histopathology (i.e., the presence of atypical hyperplasia) increases the risk of a woman for BC and is included in the BCRAT model [95]. However, it can be difficult or expensive to collect and, therefore, has limited use in a population-wide public health approach. Indeed, most models that considered this predictor did not have the information and coded the variable as unknown [43,47,48,57,73]. On the other hand, including unique risk factors such as mammographic masses and microcalcifications, as performed by Eriksson et al. (2020) [66], could improve BC risk prediction tools. Lastly, the effect of some risk factors, such as family history, needs to be carefully considered as it may inflate the value of AUC when cases have enriched and strong family history of BC. This has been shown in the study by Starlard-Davenport et al. (2018), reporting an AUC of 0.68 (CI 95%: 0.64–0.72) for the 5-year risk of overall BC in African American women that was significantly higher than other models developed in African American women but unselected for family history [61].
The heterogeneity of populations is also challenging when choosing a prediction tool. We observed that only a limited number of risk models were developed or validated in non-White populations. The models developed or validated on individuals of Latin or African descent performed particularly poorly, with the highest AUC of 0.68 (CI 95%: 0.64–0.72) for African descent [61] and 0.60 (CI 95%: 0.55–0.68) for Latin descent [44]. In comparison, models developed or validated in Asian women showed fairly similar performance to the ones developed in White populations [50], with the highest AUC of 0.72 (CI 95%: 0.62–0.82) [59]. When integrating PRS into public health practice, we need to ensure that it does not exacerbate health disparities. Currently, risk prediction tools, including a PRS, are not easily generalizable across diverse populations. Other ethnic groups have been underrepresented in GWAS, including about 80% of participants from European ancestry [96,97]. This is even more problematic for African, Hispanic or Indigenous individuals who were included in less than 4.0% of the GWAS studies from the first decade of their development [98]. The poor performance of models for non-White populations may be explained by the fact that PRS are usually calculated as a weighted sum of the risk alleles of SNPs derived from GWAS. However, most PRS do not account for effect sizes being different than the reference of populations of European descent [98,99]. Also, events such as the “flip-flop” phenomenon where a variant is a risk factor in one population but a protector in another have been observed in about 30 to 40% of variants across studies and affect the performance of risk prediction models [11,78]. Thus, the performance of the PRS declines with increasing genetic divergence from the reference population, resulting in attenuated associations partly due to variation in linkage disequilibrium patterns and allele frequencies. Therefore, many researchers and organizations have raised the need for more diverse biobanks to conduct GWAS [100].
In conclusion, although the addition of new risk factors such as SNPs has improved the discriminative ability of risk prediction models, they still need to be further evaluated to address the potential barriers to using these tools and the appropriate threshold for interventions and/or recommendations [17,18]. Also, there is currently no recommendation for any tools predicting individual risk to be used as the standard in a screening context. Therefore, comparative assessment and validation of risk prediction models in the same populations would be necessary to evaluate the effect of individual risk factors and determine which tool could be useful at the population level [25,101].
5. Strengths and Limitations
Our review has many strengths worth mentioning. To our knowledge, this is the first systematic review focusing specifically on BC risk prediction models, including a PRS. We used a rigorous methodologic approach where two reviewers independently performed each step of study selection and data extraction. The publication of the review protocol was another strength that ensured transparency in our work. Finally, including multiple measures of discrimination from the same study allowed us to appraise the incremental improvement resulting from adding genetic and non-genetic factors to the PRS. However, our review also has some limitations. Although two reviewers were involved in identifying the studies, we cannot exclude the possibility that some studies might have been missed. In fact, genetic research related to cancer is a growing field, and new articles on the subject are published regularly. We included only studies published in English or French, and those available in the gray literature or published in other languages were not considered. Also, we did not include studies focusing on the development or validation of new methodological methods for risk prediction tools or simulation studies, as those were outside the scope of this review. Furthermore, it was not possible to present pooled results of individual studies in a meta-analysis due to the heterogeneity of included studies in terms of predictors and PRS. Some limitations were due to the quality of individual studies. A measure of calibration or reclassification was not always provided in models, making it difficult to determine how close the estimated risk was to the predicted risk. Finally, studies showed the predictive performance of models, but only some of them considered the clinical and practical utility of these models [102].
6. Conclusions
Our research brings evidence on BC risk prediction tools incorporating a PRS. This review shows that the combination of genetic and non-genetic risk factors and PRS tends to increase the predictive performance compared to the PRS only and can improve risk stratification in the population. While most tools’ discriminative accuracy was still modest, predictive performance is only one component when considering if a risk prediction tool will be implemented and useful in a clinical or public health setting. Many barriers, legal, social, ethical and economic, can influence the implementation of a prediction tool. Therefore, this review is only a first step in understanding the issues related to the validation of BC risk prediction tools, including a genetic risk score, and more studies are needed to shed light on potential challenges in implementing these tools.
References
- WHO. Cancer n.d. Available online: https://www.who.int/news-room/fact-sheets/detail/cancer (accessed on 26 September 2019).
- Jin, J. Breast Cancer Screening: Benefits and Harms. JAMA 2014, 312, 2585. [Google Scholar] [CrossRef] [PubMed]
- Dibden, A.; Offman, J.; Duffy, S.W.; Gabe, R. Worldwide Review and Meta-Analysis of Cohort Studies Measuring the Effect of Mammography Screening Programmes on Incidence-Based Breast Cancer Mortality. Cancers 2020, 12, 976. [Google Scholar] [CrossRef] [PubMed]
- Klarenbach, S.; Sims-Jones, N.; Lewin, G.; Singh, H.; Thériault, G.; Tonelli, M.; Doull, M.; Courage, S.; Garcia, A.J.; Thombs, B.D. Recommendations on screening for breast cancer in women aged 40–74 years who are not at increased risk for breast cancer. CMAJ 2018, 190, E1441–E1451. [Google Scholar] [CrossRef] [PubMed]
- Ren, W.; Chen, M.; Qiao, Y.; Zhao, F. Global guidelines for breast cancer screening: A systematic review. Breast Off. J. Eur. Soc. Mastology 2022, 64, 85–99. [Google Scholar] [CrossRef] [PubMed]
- Łukasiewicz, S.; Czeczelewski, M.; Forma, A.; Baj, J.; Sitarz, R.; Stanisławek, A. Breast Cancer—Epidemiology, Risk Factors, Classification, Prognostic Markers, and Current Treatment Strategies—An Updated Review. Cancers 2021, 13, 4287. [Google Scholar] [CrossRef] [PubMed]
- Shieh, Y.; Eklund, M.; Madlensky, L.; Sawyer, S.D.; Thompson, C.K.; Stover Fiscalini, A.; Ziv, E.; Van’t Veer, L.J.; Esserman, L.J.; Tice, J.A.; et al. Breast Cancer Screening in the Precision Medicine Era: Risk-Based Screening in a Population-Based Trial. J. Natl. Cancer Inst. 2017, 109, djw290. [Google Scholar] [CrossRef] [PubMed]
- Pashayan, N.; Antoniou, A.C.; Ivanus, U.; Esserman, L.J.; Easton, D.F.; French, D.; Sroczynski, G.; Hall, P.; Cuzick, J.; Evans, D.G.; et al. Personalized early detection and prevention of breast cancer: ENVISION consensus statement. Nat. Rev. Clin. Oncol. 2020, 17, 687–705. [Google Scholar] [CrossRef] [PubMed]
- Clift, A.K.; Dodwell, D.; Lord, S.; Petrou, S.; Brady, S.M.; Collins, G.S.; Hippisley-Cox, J. The current status of risk-stratified breast screening. Br. J. Cancer 2022, 126, 533–550. [Google Scholar] [CrossRef]
- Michailidou, K.; Lindström, S.; Dennis, J.; Beesley, J.; Hui, S.; Kar, S.; Lemaçon, A.; Soucy, P.; Glubb, D.; Rostamianfar, A.; et al. Association analysis identifies 65 new breast cancer risk loci. Nature 2017, 551, 92–94. [Google Scholar] [CrossRef]
- Roberts, E.; Howell, S.; Evans, D.G. Polygenic risk scores and breast cancer risk prediction. Breast Off. J. Eur. Soc. Mastology 2023, 67, 71–77. [Google Scholar] [CrossRef]
- Mavaddat, N.; Michailidou, K.; Dennis, J.; Lush, M.; Fachal, L.; Lee, A.; Tyrer, J.P.; Chen, T.-H.; Wang, Q.; Bolla, M.K.; et al. Polygenic Risk Scores for Prediction of Breast Cancer and Breast Cancer Subtypes. Am. J. Hum. Genet. 2019, 104, 21–34. [Google Scholar] [CrossRef] [PubMed]
- Lee, A.; Mavaddat, N.; Wilcox, A.N.; Cunningham, A.P.; Carver, T.; Hartley, S.; Babb de Villiers, C.; Izquierdo, A.; Simard, J.; Schmidt, M.K.; et al. BOADICEA: A comprehensive breast cancer risk prediction model incorporating genetic and nongenetic risk factors. Genet. Med. 2019, 21, 1708–1718. [Google Scholar] [CrossRef] [PubMed]
- Mavaddat, N.; Ficorella, L.; Carver, T.; Lee, A.; Cunningham, A.P.; Lush, M.; Dennis, J.; Tischkowitz, M.; Downes, K.; Hu, D.; et al. Incorporating alternative Polygenic Risk Scores into the BOADICEA breast cancer risk prediction model. Cancer Epidemiol. Biomark. Prev. 2023, 32, 422–427. [Google Scholar] [CrossRef] [PubMed]
- Yanes, T.; Young, M.-A.; Meiser, B.; James, P.A. Clinical applications of polygenic breast cancer risk: A critical review and perspectives of an emerging field. Breast Cancer Res. 2020, 22, 21. [Google Scholar] [CrossRef] [PubMed]
- Zeinomar, N.; Chung, W.K. Cases in Precision Medicine: The Role of Polygenic Risk Scores in Breast Cancer Risk Assessment. Ann. Intern. Med. 2021, 174, 408–412. [Google Scholar] [CrossRef] [PubMed]
- Louro, J.; Posso, M.; Hilton Boon, M.; Román, M.; Domingo, L.; Castells, X.; Sala, M. A systematic review and quality assessment of individualised breast cancer risk prediction models. Br. J. Cancer 2019, 121, 76–85. [Google Scholar] [CrossRef] [PubMed]
- Usher-Smith, J.; Emery, J.; Hamilton, W.; Griffin, S.J.; Walter, F.M. Risk prediction tools for cancer in primary care. Br. J. Cancer 2015, 113, 1645–1650. [Google Scholar] [CrossRef] [PubMed]
- Gail, M.H.; Brinton, L.A.; Byar, D.P.; Corle, D.K.; Green, S.B.; Schairer, C.; Mulvihill, J.J. Projecting individualized probabilities of developing breast cancer for white females who are being examined annually. J. Natl. Cancer Inst. 1989, 81, 1879–1886. [Google Scholar] [CrossRef]
- Tyrer, J.; Duffy, S.W.; Cuzick, J. A breast cancer prediction model incorporating familial and personal risk factors. Stat. Med. 2004, 23, 1111–1130. [Google Scholar] [CrossRef]
- Mazzola, E.; Blackford, A.; Parmigiani, G.; Biswas, S. Recent Enhancements to the Genetic Risk Prediction Model BRCAPRO. Cancer Inform. 2015, 14, 147–157. [Google Scholar] [CrossRef]
- Lee, A.; Mavaddat, N.; Cunningham, A.; Carver, T.; Ficorella, L.; Archer, S.; Walter, F.M.; Tischkowitz, M.; Roberts, J.; Usher-Smith, J.; et al. Enhancing the BOADICEA cancer risk prediction model to incorporate new data on RAD51C, RAD51D, BARD1 updates to tumour pathology and cancer incidence. J. Med. Genet. 2022, 59, 1206–1218. [Google Scholar] [CrossRef]
- Yang, X.; Eriksson, M.; Czene, K.; Lee, A.; Leslie, G.; Lush, M.; Wang, J.; Dennis, J.; Dorling, L.; Carvalho, S.; et al. Prospective validation of the BOADICEA multifactorial breast cancer risk prediction model in a large prospective cohort study. J. Med. Genet. 2022, 59, 1196–1205. [Google Scholar] [CrossRef] [PubMed]
- Lakeman, I.M.M.; Rodríguez-Girondo, M.; Lee, A.; Ruiter, R.; Stricker, B.H.; Wijnant, S.R.A.; Kavousi, M.; Antoniou, A.C.; Schmidt, M.K.; Uitterlinden, A.G.; et al. Validation of the BOADICEA model and a 313-variant polygenic risk score for breast cancer risk prediction in a Dutch prospective cohort. Genet. Med. Off. J. Am. Coll. Med. Genet. 2020, 22, 1803–1811. [Google Scholar] [CrossRef] [PubMed]
- Pal Choudhury, P.; Brook, M.N.; Hurson, A.N.; Lee, A.; Mulder, C.V.; Coulson, P.; Schoemaker, M.J.; Jones, M.E.; Swerdlow, A.J.; Chatterjee, N.; et al. Comparative validation of the BOADICEA and Tyrer-Cuzick breast cancer risk models incorporating classical risk factors and polygenic risk in a population-based prospective cohort of women of European ancestry. Breast Cancer Res. 2021, 23, 22. [Google Scholar] [CrossRef] [PubMed]
- Ding, Y.; Hou, K.; Burch, K.S.; Lapinska, S.; Privé, F.; Vilhjálmsson, B.; Sankararaman, S.; Pasaniuc, B. Large uncertainty in individual polygenic risk score estimation impacts PRS-based risk stratification. Nat. Genet. 2022, 54, 30–39. [Google Scholar] [CrossRef]
- Debray, T.P.A.; Damen, J.A.A.G.; Snell, K.I.E.; Ensor, J.; Hooft, L.; Reitsma, J.B.; Riley, R.D.; Moons, K.G.M. A guide to systematic review and meta-analysis of prediction model performance. BMJ 2017, 356, i6460. [Google Scholar] [CrossRef] [PubMed]
- Page, M.J.; McKenzie, J.E.; Bossuyt, P.M.; Boutron, I.; Hoffmann, T.C.; Mulrow, C.D.; Shamseer, L.; Tetzlaff, J.M.; Akl, E.A.; Brennan, S.E.; et al. The PRISMA 2020 statement: An updated guideline for reporting systematic reviews. BMJ 2021, 372, n71. [Google Scholar] [CrossRef] [PubMed]
- Moons, K.G.M.; de Groot, J.A.H.; Bouwmeester, W.; Vergouwe, Y.; Mallett, S.; Altman, D.G.; Reitsma, J.B.; Collins, G.S. Critical appraisal and data extraction for systematic reviews of prediction modelling studies: The CHARMS checklist. PLoS Med. 2014, 11, e1001744. [Google Scholar] [CrossRef] [PubMed]
- Collins, G.S.; Reitsma, J.B.; Altman, D.G.; Moons, K.G. Transparent reporting of a multivariable prediction model for individual prognosis or diagnosis (TRIPOD): The TRIPOD Statement. BMC Med. 2015, 13, 1. [Google Scholar] [CrossRef]
- Steyerberg, E.W.; Vickers, A.J.; Cook, N.R.; Gerds, T.; Gonen, M.; Obuchowski, N.; Pencina, M.J.; Kattan, M.W. Assessing the performance of prediction models: A framework for some traditional and novel measures. Epidemiology 2010, 21, 128–138. [Google Scholar] [CrossRef]
- Zou, K.H.; O’Malley, A.J.; Mauri, L. Receiver-Operating Characteristic Analysis for Evaluating Diagnostic Tests and Predictive Models. Circulation 2007, 115, 654–657. [Google Scholar] [CrossRef] [PubMed]
- Kerr, K.F.; Wang, Z.; Janes, H.; McClelland, R.L.; Psaty, B.M.; Pepe, M.S. Net Reclassification Indices for Evaluating Risk-Prediction Instruments: A Critical Review. Epidemiol. Camb. Mass 2014, 25, 114–121. [Google Scholar] [CrossRef] [PubMed]
- Pencina, M.J.; D’Agostino, R.B.; D’Agostino, R.B.; Vasan, R.S. Evaluating the added predictive ability of a new marker: From area under the ROC curve to reclassification and beyond. Stat. Med. 2008, 27, 157–172; discussion 207–212. [Google Scholar] [CrossRef] [PubMed]
- Wolff, R.F.; Moons, K.G.M.; Riley, R.D.; Whiting, P.F.; Westwood, M.; Collins, G.S.; Reitsma, J.B.; Kleijnen, J.; Mallett, S.; PROBAST Group. PROBAST: A Tool to Assess the Risk of Bias and Applicability of Prediction Model Studies. Ann. Intern. Med. 2019, 170, 51–58. [Google Scholar] [CrossRef] [PubMed]
- Rosner, B.; Tamimi, R.M.; Kraft, P.; Gao, C.; Mu, Y.; Scott, C.; Winham, S.J.; Vachon, C.M.; Colditz, G.A. Simplified Breast Risk Tool Integrating Questionnaire Risk Factors, Mammographic Density, and Polygenic Risk Score: Development and Validation. Cancer Epidemiol. Biomarkers Prev. 2021, 30, 600–607. [Google Scholar] [CrossRef] [PubMed]
- Zhang, X.; Rice, M.; Tworoger, S.S.; Rosner, B.A.; Eliassen, A.H.; Tamimi, R.M.; Joshi, A.D.; Lindstrom, S.; Qian, J.; Colditz, G.A.; et al. Addition of a polygenic risk score, mammographic density, and endogenous hormones to existing breast cancer risk prediction models: A nested case–control study. PLoS Med. 2018, 15, e1002644. [Google Scholar] [CrossRef] [PubMed]
- Evans, D.; Brentnall, A.R.; Byers, H.; Harkness, E.; Stavrinos, P.; Howell, A.; Newman, W.; Cuzick, J. The impact of a panel of 18 single nucleotide polymorphisms on breast cancer risk in women attending a UK familial-screening clinic: A case-control study. J. Med. Genet. 2017, 54, 111–113. [Google Scholar] [CrossRef]
- Lello, L.; Raben, T.G.; Hsu, S.D.H. Sibling validation of polygenic risk scores and complex trait prediction. Sci. Rep. 2020, 10, 13190. [Google Scholar] [CrossRef]
- Kramer, I.; Hooning, M.J.; Mavaddat, N.; Hauptmann, M.; Keeman, R.; Steyerberg, E.W.; Giardiello, D.; Antoniou, A.C.; Pharoah, P.D.P.; Canisius, S.; et al. Breast Cancer Polygenic Risk Score and Contralateral Breast Cancer Risk. Am. J. Hum. Genet. 2020, 107, 837–848. [Google Scholar] [CrossRef]
- Giardiello, D.; Hooning, M.J.; Hauptmann, M.; Keeman, R.; Heemskerk-Gerritsen, B.A.M.; Becher, H.; Blomqvist, C.; Bojesen, S.E.; Bolla, M.K.; Camp, N.J.; et al. PredictCBC-2.0: A contralateral breast cancer risk prediction model developed and validated in ~ 200,000 patients. Breast Cancer Res. 2022, 24, 69. [Google Scholar] [CrossRef]
- Borde, J.; Ernst, C.; Wappenschmidt, B.; Niederacher, D.; Weber-Lassalle, K.; Schmidt, G.; Hauke, J.; Quante, A.S.; Weber-Lassalle, N.; Horváth, J.; et al. Performance of Breast Cancer Polygenic Risk Scores in 760 Female CHEK2 Germline Mutation Carriers. J. Natl. Cancer Inst. 2021, 113, 893–899. [Google Scholar] [CrossRef] [PubMed]
- Allman, R.; Dite, G.S.; Hopper, J.L.; Gordon, O.; Starlard-Davenport, A.; Chlebowski, R.; Kooperberg, C. SNPs and breast cancer risk prediction for African American and Hispanic women. Breast Cancer Res. Treat. 2015, 154, 583–589. [Google Scholar] [CrossRef] [PubMed]
- Allman, R.; Spaeth, E.; Lai, J.; Gross, S.J.; Hopper, J.L. A streamlined model for use in clinical breast cancer risk assessment maintains predictive power and is further improved with inclusion of a polygenic risk score. PLoS ONE 2021, 16, e0245375. [Google Scholar] [CrossRef] [PubMed]
- Brentnall, A.R.; van Veen, E.M.; Harkness, E.F.; Rafiq, S.; Byers, H.; Astley, S.M.; Sampson, S.; Howell, A.; Newman, W.G.; Cuzick, J.; et al. A case-control evaluation of 143 single nucleotide polymorphisms for breast cancer risk stratification with classical factors and mammographic density. Int. J. Cancer 2020, 146, 2122–2129. [Google Scholar] [CrossRef] [PubMed]
- Darabi, H.; Czene, K.; Zhao, W.; Liu, J.; Hall, P.; Humphreys, K. Breast cancer risk prediction and individualised screening based on common genetic variation and breast density measurement. Breast Cancer Res. BCR 2012, 14, R25. [Google Scholar] [CrossRef] [PubMed]
- Dite, G.S.; Mahmoodi, M.; Bickerstaffe, A.; Hammet, F.; Macinnis, R.J.; Tsimiklis, H.; Dowty, J.G.; Apicella, C.; Phillips, K.-A.; Giles, G.G.; et al. Using SNP genotypes to improve the discrimination of a simple breast cancer risk prediction model. Breast Cancer Res. Treat. 2013, 139, 887–896. [Google Scholar] [CrossRef]
- Dite, G.S.; MacInnis, R.J.; Bickerstaffe, A.; Dowty, J.G.; Allman, R.; Apicella, C.; Milne, R.L.; Tsimiklis, H.; Phillips, K.-A.; Giles, G.G.; et al. Breast Cancer Risk Prediction Using Clinical Models and 77 Independent Risk-Associated SNPs for Women Aged Under 50 Years: Australian Breast Cancer Family Registry. Cancer Epidemiol. Biomark. Prev. 2016, 25, 359–365. [Google Scholar] [CrossRef]
- Du, Z.; Gao, G.; Adedokun, B.; Ahearn, T.; Lunetta, K.L.; Zirpoli, G.; Troester, M.A.; Ruiz-Narváez, E.A.; Haddad, S.A.; PalChoudhury, P.; et al. Evaluating Polygenic Risk Scores for Breast Cancer in Women of African Ancestry. J. Natl. Cancer Inst. 2021, 113, 1168–1176. [Google Scholar] [CrossRef]
- Ho, W.-K.; Tan, M.-M.; Mavaddat, N.; Tai, M.-C.; Mariapun, S.; Li, J.; Ho, P.-J.; Dennis, J.; Tyrer, J.P.; Bolla, M.K.; et al. European polygenic risk score for prediction of breast cancer shows similar performance in Asian women. Nat. Commun. 2020, 11, 3833. [Google Scholar] [CrossRef]
- Hurson, A.N.; Pal Choudhury, P.; Gao, C.; Hüsing, A.; Eriksson, M.; Shi, M.; Jones, M.E.; Evans, D.G.R.; Milne, R.L.; Gaudet, M.M.; et al. Prospective evaluation of a breast-cancer risk model integrating classical risk factors and polygenic risk in 15 cohorts from six countries. Int. J. Epidemiol. 2021, 50, 1897–1911. [Google Scholar] [CrossRef]
- Hüsing, A.; Canzian, F.; Beckmann, L.; Garcia-Closas, M.; Diver, W.R.; Thun, M.J.; Berg, C.D.; Hoover, R.N.; Ziegler, R.G.; Figueroa, J.D.; et al. Prediction of breast cancer risk by genetic risk factors, overall and by hormone receptor status. J. Med. Genet. 2012, 49, 601–608. [Google Scholar] [CrossRef] [PubMed]
- Jantzen, R.; Payette, Y.; de Malliard, T.; Labbé, C.; Noisel, N.; Broët, P. Validation of breast cancer risk assessment tools on a French-Canadian population-based cohort. BMJ Open 2021, 11, e045078. [Google Scholar] [CrossRef] [PubMed]
- Lee, C.P.L.; Choi, H.; Soo, K.C.; Tan, M.-H.; Chay, W.Y.; Chia, K.S.; Liu, J.; Li, J.; Hartman, M. Mammographic Breast Density and Common Genetic Variants in Breast Cancer Risk Prediction. PLoS ONE 2015, 10, e0136650. [Google Scholar] [CrossRef] [PubMed]
- Maas, P.; Barrdahl, M.; Joshi, A.D.; Auer, P.L.; Gaudet, M.M.; Milne, R.L.; Schumacher, F.R.; Anderson, W.F.; Check, D.; Chattopadhyay, S.; et al. Breast Cancer Risk from Modifiable and Nonmodifiable Risk Factors Among White Women in the United States. JAMA Oncol. 2016, 2, 1295–1302. [Google Scholar] [CrossRef] [PubMed]
- Mavaddat, N.; Pharoah, P.D.P.; Michailidou, K.; Tyrer, J.; Brook, M.N.; Bolla, M.K.; Wang, Q.; Dennis, J.; Dunning, A.M.; Shah, M.; et al. Prediction of breast cancer risk based on profiling with common genetic variants. J. Natl. Cancer Inst. 2015, 107, djv036. [Google Scholar] [CrossRef] [PubMed]
- Mealiffe, M.E.; Stokowski, R.P.; Rhees, B.K.; Prentice, R.L.; Pettinger, M.; Hinds, D.A. Assessment of clinical validity of a breast cancer risk model combining genetic and clinical information. J. Natl. Cancer Inst. 2010, 102, 1618–1627. [Google Scholar] [CrossRef] [PubMed]
- Pal Choudhury, P.; Wilcox, A.N.; Brook, M.N.; Zhang, Y.; Ahearn, T.; Orr, N.; Coulson, P.; Schoemaker, M.J.; Jones, M.E.; Gail, M.H.; et al. Comparative Validation of Breast Cancer Risk Prediction Models and Projections for Future Risk Stratification. J. Natl. Cancer Inst. 2020, 112, 278–285. [Google Scholar] [CrossRef] [PubMed]
- Shieh, Y.; Hu, D.; Ma, L.; Huntsman, S.; Gard, C.C.; Leung, J.W.T.; Tice, J.A.; Vachon, C.M.; Cummings, S.R.; Kerlikowske, K.; et al. Breast cancer risk prediction using a clinical risk model and polygenic risk score. Breast Cancer Res. Treat. 2016, 159, 513–525. [Google Scholar] [CrossRef]
- Shieh, Y.; Hu, D.; Ma, L.; Huntsman, S.; Gard, C.C.; Leung, J.W.T.; Tice, J.A.; Ziv, E.; Kerlikowske, K.; Cummings, S.R. Joint relative risks for estrogen receptor-positive breast cancer from a clinical model, polygenic risk score, and sex hormones. Breast Cancer Res. Treat. 2017, 166, 603–612. [Google Scholar] [CrossRef]
- Starlard-Davenport, A.; Allman, R.; Dite, G.S.; Hopper, J.L.; Spaeth Tuff, E.; Macleod, S.; Kadlubar, S.; Preston, M.; Henry-Tillman, R. Validation of a genetic risk score for Arkansas women of color. PLoS ONE 2018, 13, e0204834. [Google Scholar] [CrossRef]
- van Veen, E.M.; Brentnall, A.R.; Byers, H.; Harkness, E.F.; Astley, S.M.; Sampson, S.; Howell, A.; Newman, W.G.; Cuzick, J.; Evans, D.G.R. Use of Single-Nucleotide Polymorphisms and Mammographic Density Plus Classic Risk Factors for Breast Cancer Risk Prediction. JAMA Oncol. 2018, 4, 476–482. [Google Scholar] [CrossRef]
- Vachon, C.M.; Pankratz, V.S.; Scott, C.G.; Haeberle, L.; Ziv, E.; Jensen, M.R.; Brandt, K.R.; Whaley, D.H.; Olson, J.E.; Heusinger, K.; et al. The contributions of breast density and common genetic variation to breast cancer risk. J. Natl. Cancer Inst. 2015, 107, dju397. [Google Scholar] [CrossRef] [PubMed]
- Wen, W.; Shu, X.-O.; Guo, X.; Cai, Q.; Long, J.; Bolla, M.K.; Michailidou, K.; Dennis, J.; Wang, Q.; Gao, Y.-T.; et al. Prediction of breast cancer risk based on common genetic variants in women of East Asian ancestry. Breast Cancer Res. BCR 2016, 18, 124. [Google Scholar] [CrossRef] [PubMed]
- Zheng, W.; Wen, W.; Gao, Y.-T.; Shyr, Y.; Zheng, Y.; Long, J.; Li, G.; Li, C.; Gu, K.; Cai, Q.; et al. Genetic and Clinical Predictors for Breast Cancer Risk Assessment and Stratification Among Chinese Women. JNCI J. Natl. Cancer Inst. 2010, 102, 972–981. [Google Scholar] [CrossRef] [PubMed]
- Eriksson, M.; Czene, K.; Strand, F.; Zackrisson, S.; Lindholm, P.; Lång, K.; Förnvik, D.; Sartor, H.; Mavaddat, N.; Easton, D.; et al. Identification of Women at High Risk of Breast Cancer Who Need Supplemental Screening. Radiology 2020, 297, 327–333. [Google Scholar] [CrossRef] [PubMed]
- Gao, G.; Zhao, F.; Ahearn, T.U.; Lunetta, K.L.; Troester, M.A.; Du, Z.; Ogundiran, T.O.; Ojengbede, O.; Blot, W.; Nathanson, K.L.; et al. Polygenic risk scores for prediction of breast cancer risk in women of African ancestry: A cross-ancestry approach. Hum. Mol. Genet. 2022, 31, 3133–3143. [Google Scholar] [CrossRef] [PubMed]
- Ho, W.-K.; Tai, M.-C.; Dennis, J.; Shu, X.; Li, J.; Ho, P.J.; Millwood, I.Y.; Lin, K.; Jee, Y.-H.; Lee, S.-H.; et al. Polygenic risk scores for prediction of breast cancer risk in Asian populations. Genet. Med. Off. J. Am. Coll. Med. Genet. 2022, 24, 586–600. [Google Scholar] [CrossRef] [PubMed]
- Evans, D.G.R.; van Veen, E.M.; Harkness, E.F.; Brentnall, A.R.; Astley, S.M.; Byers, H.; Woodward, E.R.; Sampson, S.; Southworth, J.; Howell, S.J.; et al. Breast cancer risk stratification in women of screening age: Incremental effects of adding mammographic density, polygenic risk, and a gene panel. Genet. Med. 2022, 24, 1485–1494. [Google Scholar] [CrossRef]
- Hou, C.; Xu, B.; Hao, Y.; Yang, D.; Song, H.; Li, J. Development and validation of polygenic risk scores for prediction of breast cancer and breast cancer subtypes in Chinese women. BMC Cancer 2022, 22, 374. [Google Scholar] [CrossRef]
- Olsen, M.; Fischer, K.; Bossuyt, P.M.; Goetghebeur, E. Evaluating the prognostic performance of a polygenic risk score for breast cancer risk stratification. BMC Cancer 2021, 21, 1351. [Google Scholar] [CrossRef]
- Yang, Y.; Tao, R.; Shu, X.; Cai, Q.; Wen, W.; Gu, K.; Gao, Y.-T.; Zheng, Y.; Kweon, S.-S.; Shin, M.-H.; et al. Incorporating Polygenic Risk Scores and Nongenetic Risk Factors for Breast Cancer Risk Prediction Among Asian Women. JAMA Netw. Open 2022, 5, e2149030. [Google Scholar] [CrossRef]
- Li, S.X.; Milne, R.L.; Nguyen-Dumont, T.; Wang, X.; English, D.R.; Giles, G.G.; Southey, M.C.; Antoniou, A.C.; Lee, A.; Li, S.; et al. Prospective Evaluation of the Addition of Polygenic Risk Scores to Breast Cancer Risk Models. JNCI Cancer Spectr. 2021, 5, pkab021. [Google Scholar] [CrossRef] [PubMed]
- Liu, C.; Zeinomar, N.; Chung, W.K.; Kiryluk, K.; Gharavi, A.G.; Hripcsak, G.; Crew, K.D.; Shang, N.; Khan, A.; Fasel, D.; et al. Generalizability of Polygenic Risk Scores for Breast Cancer Among Women with European, African, and Latinx Ancestry. JAMA Netw. Open 2021, 4, e2119084. [Google Scholar] [CrossRef] [PubMed]
- Jia, G.; Lu, Y.; Wen, W.; Long, J.; Liu, Y.; Tao, R.; Li, B.; Denny, J.C.; Shu, X.-O.; Zheng, W. Evaluating the Utility of Polygenic Risk Scores in Identifying High-Risk Individuals for Eight Common Cancers. JNCI Cancer Spectr. 2020, 4, pkaa021. [Google Scholar] [CrossRef] [PubMed]
- Márquez-Luna, C.; Loh, P.-R.; South Asian Type 2 Diabetes (SAT2D) Consortium; SIGMA Type 2 Diabetes Consortium; Price, A.L. Multiethnic polygenic risk scores improve risk prediction in diverse populations. Genet. Epidemiol. 2017, 41, 811–823. [Google Scholar] [CrossRef] [PubMed]
- Khera, A.V.; Chaffin, M.; Aragam, K.G.; Haas, M.E.; Roselli, C.; Choi, S.H.; Natarajan, P.; Lander, E.S.; Lubitz, S.A.; Ellinor, P.T.; et al. Genome-wide polygenic scores for common diseases identify individuals with risk equivalent to monogenic mutations. Nat. Genet. 2018, 50, 1219–1224. [Google Scholar] [CrossRef] [PubMed]
- Wang, S.; Qian, F.; Zheng, Y.; Ogundiran, T.; Ojengbede, O.; Zheng, W.; Blot, W.; Nathanson, K.L.; Hennis, A.; Nemesure, B.; et al. Genetic variants demonstrating flip-flop phenomenon and breast cancer risk prediction among women of African ancestry. Breast Cancer Res. Treat. 2018, 168, 703–712. [Google Scholar] [CrossRef] [PubMed]
- Shieh, Y.; Fejerman, L.; Lott, P.C.; Marker, K.; Sawyer, S.D.; Hu, D.; Huntsman, S.; Torres, J.; Echeverry, M.; Bohórquez, M.E.; et al. A Polygenic Risk Score for Breast Cancer in US Latinas and Latin American Women. J. Natl. Cancer Inst. 2020, 112, 590–598. [Google Scholar] [CrossRef]
- Chang, C.C.; Chow, C.C.; Tellier, L.C.; Vattikuti, S.; Purcell, S.M.; Lee, J.J. Second-generation PLINK: Rising to the challenge of larger and richer datasets. GigaScience 2015, 4, 7. [Google Scholar] [CrossRef]
- Pashayan, N.; Duffy, S.W.; Chowdhury, S.; Dent, T.; Burton, H.; Neal, D.E.; Easton, D.F.; Eeles, R.; Pharoah, P. Polygenic susceptibility to prostate and breast cancer: Implications for personalised screening. Br. J. Cancer 2011, 104, 1656–1663. [Google Scholar] [CrossRef]
- Wacholder, S.; Hartge, P.; Prentice, R.; Garcia-Closas, M.; Feigelson, H.S.; Diver, W.R.; Thun, M.J.; Cox, D.G.; Hankinson, S.E.; Kraft, P.; et al. Performance of Common Genetic Variants in Breast-Cancer Risk Models. N. Engl. J. Med. 2010, 362, 986–993. [Google Scholar] [CrossRef] [PubMed]
- Läll, K.; Lepamets, M.; Palover, M.; Esko, T.; Metspalu, A.; Tõnisson, N.; Padrik, P.; Mägi, R.; Fischer, K. Polygenic prediction of breast cancer: Comparison of genetic predictors and implications for risk stratification. BMC Cancer 2019, 19, 557. [Google Scholar] [CrossRef] [PubMed]
- Zhang, H.; Ahearn, T.U.; Lecarpentier, J.; Barnes, D.; Beesley, J.; Qi, G.; Jiang, X.; O’Mara, T.A.; Zhao, N.; Bolla, M.K.; et al. Genome-wide association study identifies 32 novel breast cancer susceptibility loci from overall and subtype-specific analyses. Nat. Genet. 2020, 52, 572–581. [Google Scholar] [CrossRef] [PubMed]
- Benichou, J.; Gail, M.H. Methods of inference for estimates of absolute risk derived from population-based case-control studies. Biometrics 1995, 51, 182–194. [Google Scholar] [CrossRef] [PubMed]
- Altman, D.G.; Royston, P. What do we mean by validating a prognostic model? Stat. Med. 2000, 19, 453–473. [Google Scholar] [CrossRef]
- Courvoisier, D.S.; Combescure, C.; Agoritsas, T.; Gayet-Ageron, A.; Perneger, T.V. Performance of logistic regression modeling: Beyond the number of events per variable, the role of data structure. J. Clin. Epidemiol. 2011, 64, 993–1000. [Google Scholar] [CrossRef] [PubMed]
- Ogundimu, E.O.; Altman, D.G.; Collins, G.S. Adequate sample size for developing prediction models is not simply related to events per variable. J. Clin. Epidemiol. 2016, 76, 175–182. [Google Scholar] [CrossRef]
- Austin, P.C.; Steyerberg, E.W. Events per variable (EPV) and the relative performance of different strategies for estimating the out-of-sample validity of logistic regression models. Stat. Methods Med. Res. 2017, 26, 796–808. [Google Scholar] [CrossRef]
- Anderssen, E.; Dyrstad, K.; Westad, F.; Martens, H. Reducing over-optimism in variable selection by cross-model validation. Chemom. Intell. Lab. Syst. 2006, 84, 69–74. [Google Scholar] [CrossRef]
- Wu, C.; Ma, S. A selective review of robust variable selection with applications in bioinformatics. Brief. Bioinform. 2015, 16, 873–883. [Google Scholar] [CrossRef]
- Brentnall, A.R.; Cuzick, J. Use of the concordance index for predictors of censored survival data. Stat. Methods Med. Res. 2018, 27, 2359–2373. [Google Scholar] [CrossRef] [PubMed]
- Verbakel, J.Y.; Steyerberg, E.W.; Uno, H.; Cock, B.D.; Wynants, L.; Collins, G.S.; Calster, B.V. ROC curves for clinical prediction models part 1. ROC plots showed no added value above the AUC when evaluating the performance of clinical prediction models. J. Clin. Epidemiol. 2020, 126, 207–216. [Google Scholar] [CrossRef] [PubMed]
- Aarts, A.; Duffy, S.; Geurts, S.; Vulkan, D.; Otten, J.; Hsu, C.-Y.; Chen, T.; Verbeek, A.; Broeders, M. Test sensitivity of mammography and mean sojourn time over 40 years of breast cancer screening in Nijmegen (The Netherlands). J. Med. Screen. 2019, 26, 147–153. [Google Scholar] [CrossRef] [PubMed]
- Costantino, J.P.; Gail, M.H.; Pee, D.; Anderson, S.; Redmond, C.K.; Benichou, J.; Wieand, H.S. Validation Studies for Models Projecting the Risk of Invasive and Total Breast Cancer Incidence. JNCI J. Natl. Cancer Inst. 1999, 91, 1541–1548. [Google Scholar] [CrossRef] [PubMed]
- Martin, A.R.; Kanai, M.; Kamatani, Y.; Okada, Y.; Neale, B.M.; Daly, M.J. Current clinical use of polygenic scores will risk exacerbating health disparities. Nat. Genet. 2019, 51, 584–591. [Google Scholar] [CrossRef] [PubMed]
- McClellan, K.A.; Avard, D.; Simard, J.; Knoppers, B.M. Personalized medicine and access to health care: Potential for inequitable access? Eur. J. Hum. Genet. 2013, 21, 143–147. [Google Scholar] [CrossRef] [PubMed]
- Duncan, L.; Shen, H.; Gelaye, B.; Meijsen, J.; Ressler, K.; Feldman, M.; Peterson, R.; Domingue, B. Analysis of polygenic risk score usage and performance in diverse human populations. Nat. Commun. 2019, 10, 3328. [Google Scholar] [CrossRef] [PubMed]
- Lewis, C.M.; Vassos, E. Polygenic risk scores: From research tools to clinical instruments. Genome Med. 2020, 12, 44. [Google Scholar] [CrossRef]
- Fatumo, S.; Chikowore, T.; Choudhury, A.; Ayub, M.; Martin, A.R.; Kuchenbaecker, K. A roadmap to increase diversity in genomic studies. Nat. Med. 2022, 28, 243–250. [Google Scholar] [CrossRef]
- Terry, M.B.; Liao, Y.; Whittemore, A.S.; Leoce, N.; Buchsbaum, R.; Zeinomar, N.; Dite, G.S.; Chung, W.K.; Knight, J.A.; Southey, M.C.; et al. 10-year performance of four models of breast cancer risk: A validation study. Lancet Oncol. 2019, 20, 504–517. [Google Scholar] [CrossRef]
- Moorthie, S.; Hall, A.; Janus, J.; Brigden, T.; Babb de Villiers, C.; Blackburn, L.; Johnson, E.; Kroese, M. Polygenic Scores and Clinical Utility; PHG Foundation: Cambridge, UK, 2021; 53p. [Google Scholar]